Cracking the Code: How Bankers Slice the Global Pie (2023)


The Definitive Guide to Equity Index Investing - PART 3
This article is Part 3 of our definitive guide to Equity Index Investing.
Most investors starting out would be confused to learn that, for example, investing in an MSCI World ETF wouldn’t provide them with a Global exposure.
Equity ETFs can be confusing due to Index Providers’ naming conventions. So, I had a deep dive into how they work, and I hope you can also benefit from it.
KEY TAKEAWAYS
- Most Equity ETFs track either an MSCI or FTSE Benchmark. Some ETFs may track a niche provider – Solactive.
- A diversified tracker can cover the U.S. Market, Developed and Emerging Markets. Frontier Markets like Vietnam are marginal and need a separate ETF.
- Most ETFs comprise Mid and Large Caps. However, exposure to 10%-15% of Small Caps is typically not captured. But some Small Cap Stocks are the black hole of investing, and not having exposure to them has historically been beneficial.
- Since we first ran this analysis in Q1’20, the U.S. Market’s relative share increased, at the expense of Japan, to represent 60% of Global Indices. India’s size in EM Indices has increased from 8% to 13%, while China lost 6%.
- Recommended UCITS ETFs and US ETFs listed below allow you to control your home market allocation.
Here is the full analysis
Let's start with MSCI Indices
To understand Equity ETFs, you need to find the suitable benchmark. I will start by describing the structure of the Market using MSCI Indices since they have a longer history. Following this introduction, I will show differences with the FTSE Global Index Series to let you decide which one is more suitable as a benchmark for your ETFs.
What Does MSCI stand for?
MSCI, originally known as Morgan Stanley Capital International, began as a subsidiary of the financial behemoth Morgan Stanley. However, in a pivotal move, MSCI charted its independent course in 2007, going public and distancing itself from its parent company. Since then, MSCI has grown exponentially, establishing itself as a titan in the world of investment tools. Its indices have become cornerstones for global investors, and as of now, they serve as benchmarks for trillions of dollars in assets. This meteoric rise and sustained influence underscore MSCI’s significant share and dominance in the global market index space.
What Are the considerations when selecting an index?
Equity ETFs typically comprise companies based on two main characteristics:
- Market Types
- Size of Companies
Advertisement

As of 29/03/2024, Interactive Brokers offers rates up to 4.738% (GBP), 3.445% (EUR) and 4.83% (USD) on cash.
Advertisement

As of 29/03/2024, Interactive Brokers offers rates up to 4.738% (GBP), 3.445% (EUR) and 4.83% (USD) on cash.
How Portfolio Managers Divide The World
23 Developed & 26 Emerging Markets (Animation)
What Types of Markets are covered by MSCI?
Markets are split into three categories. The country is not only assessed by its development but also to access by investors to its Capital Markets:
- Developed Markets – Markets with high income, openness to foreign ownership, ease of capital movement and efficiency of market institutions.
- Emerging Markets – Markets that have some characteristics of a developed market but do not fully meet all standards.
- Frontier Markets – Markets that are more developed than the least developing markets, but too small, risky, or illiquid to be considered an Emerging Market.
Advertisement

Advertisement

Investing in THE Global STOCK Market
Now, let’s assume you would like to invest in Developed and Emerging Markets. Global ETFs cover these two categories. An index that will allow you to access these countries, is the MSCI ACWI Index.
Country exposure IN MSCI ACWI INDEX
What is MSCI ACWI Index?
The MSCI ACWI (All Country World Index) is a comprehensive global stock index managed by MSCI. It tracks the performance of large and mid-cap companies across both developed and emerging markets, covering 23 developed and 26 emerging countries. This makes the ACWI a more inclusive representation of the global stock market compared to the MSCI World Index, which focuses solely on developed nations. Essentially, the ACWI offers investors a snapshot of the global investment opportunity set by capturing approximately 85% of the global market capitalization. By including both developed and emerging markets, the ACWI provides a broader perspective on global equity performance.
relative share of key Markets in MSCI ACWI Index
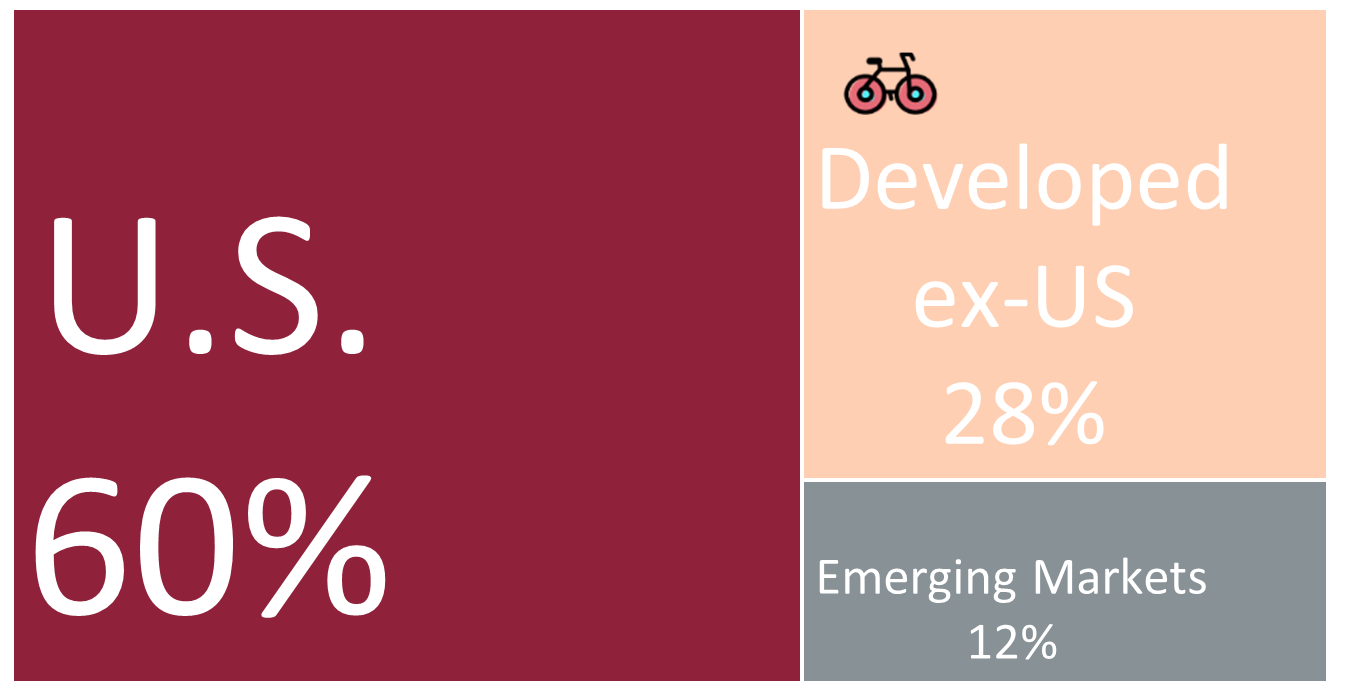
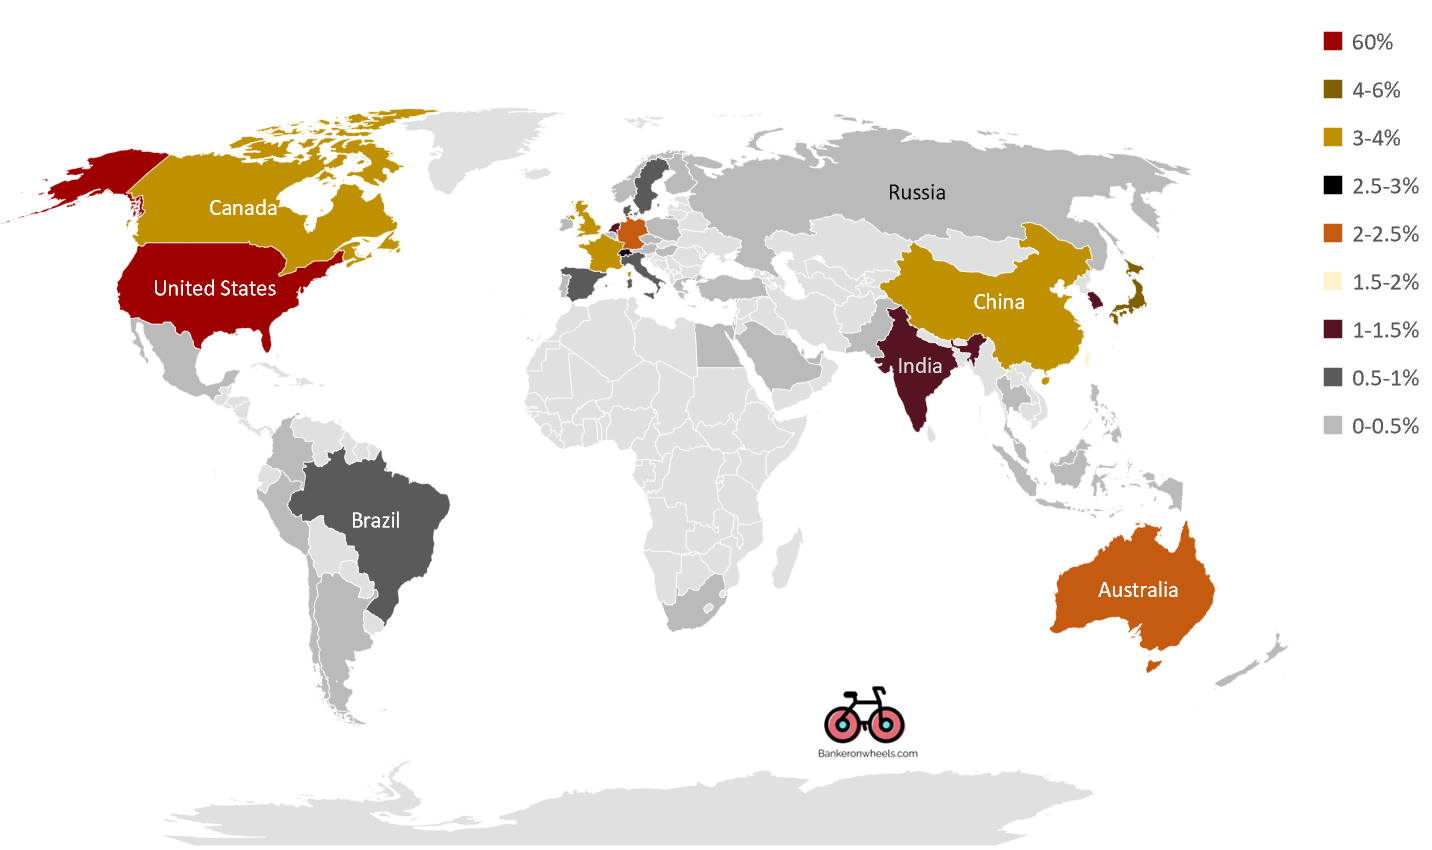
What is the relative share of key Markets in MSCI ACWI Index?
As of Q1 2023, if you buy a Global ETF, US Stocks will compose approx. 60% of your overall exposure. US exposure increased from 58% in Q1 2022. Japan represents between 5-6%.
What part of MSCI ACWI Is represented by Emerging Markets?
Emerging Markets currently represent only about 12% of all Global Stocks.
What part of MSCI ACWI Is represented by Chinese Equities?
It may be surprising that Chinese Stocks represent just below 4% of Global Equities. China’s stock markets are still relatively immature and do not play as prominent a role in the Chinese economy as America’s do in the U.S. economy. In China, only a small fraction is financed through the Public Equity Market. Instead, Chinese corporations rely heavily on bank loans and retained earnings.
What MSCI or FTSE Indices will allow me to get Global Exposure?
Any ETF that tracks one of the following Indices will provide Developed and Emerging Market exposure, and will align your portfolio with the market allocation to those countries:
- MSCI All Country World IMI Index (MSCI ACWI IMI)
- MSCI All Country World Index (MSCI ACWI)
- FTSE Global All Cap Index
- FTSE All-World Index
Investing in Developed Markets
Now, let’s assume you would like to only invest in Developed Markets. An index that will allow you to access these countries, is the MSCI World Index.
Country exposure IN MSCI World INDEX
what is MSCI World index?
The MSCI World Index, managed by MSCI (formerly Morgan Stanley Capital International), is a prominent global stock index that monitors the performance of large and mid-cap companies across 23 developed nations. Established in 1969, this index represents a broad spectrum of global markets but doesn’t include emerging and frontier economies, making its “world” title a bit narrower than one might assume. For a more comprehensive global coverage, there’s the MSCI All Country World Index (ACWI) which integrates both developed and emerging markets. Additionally, MSCI offers a Frontier Markets index that encompasses 31 other markets. The MSCI World Index is available in various forms, considering dividends and different currencies.
To confuse things, MSCI named its Developed Market Index MSCI World. Remember, it’s not a Global ETF, as it excludes Emerging Markets. This is a common mistake investors make when buying a Global ETF.
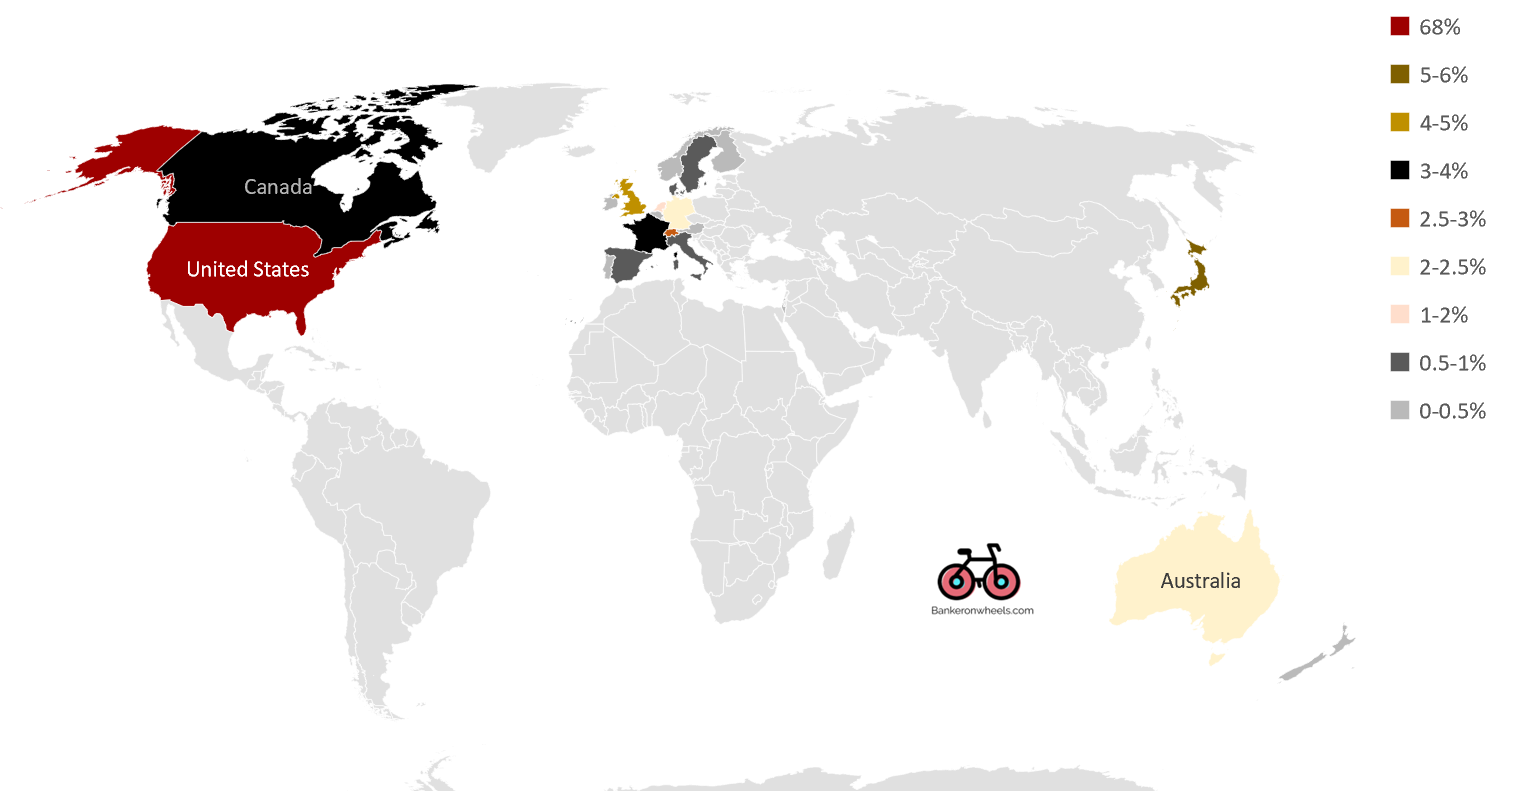
What is the relative share of key Markets in MSCI World Index?
US Stocks are heavily represented in Developed Market ETFs with an allocation of approx. 68%, which increased 2% over the past 3 years. Other key developed markets include:
- Japan – with a 5-6% allocation. Exposure to Japan dropped 2% over the past three years.
- UK – with a 4-5% allocation. Remained relatively stable over the past three years.
- EU – Minor exposures include various individual European countries.
Minor exposures include Canada, Australia or Singapore. If you want to break down the developed markets further, and isolate the US exposure, read our dedicated guide on how to get exposure to developed markets ex-U.S.
What MSCI or FTSE Indices will allow me to get Developed Markets Exposure?
Any ETF that tracks one of the following Indices will provide Developed Market exposure:
- MSCI World IMI Index (MSCI World IMI)
- MSCI World Index
- FTSE Developed All Cap Index
- FTSE Developed Index
Advertisement
As of 29/03/2024, Interactive Brokers offers rates up to 4.738% (GBP), 3.445% (EUR) and 4.83% (USD) on cash.
Advertisement
As of 29/03/2024, Interactive Brokers offers rates up to 4.738% (GBP), 3.445% (EUR) and 4.83% (USD) on cash.
Investing in Emerging Markets
Now, let’s assume you would like to only invest in Emerging Markets. An index that will allow you to access these countries, is the MSCI Emerging Markets Index.
Country exposure IN MSCI Emerging Markets INDEX
what is MSCI Emerging Markets index?
The MSCI Emerging Markets Index, curated by MSCI, is a key benchmark that tracks the performance of large and mid-cap companies across 26 emerging countries. Representing approximately 85% of the free float-adjusted market capitalization in each country, this index offers a detailed insight into the economic landscape of the emerging markets. As opposed to the MSCI World Index, which focuses on developed nations, the MSCI Emerging Markets Index provides investors with a comprehensive view of the growth potential and market dynamics unique to these rapidly developing economies. It serves as a valuable tool for those looking to diversify their portfolios and tap into the opportunities presented by emerging markets.
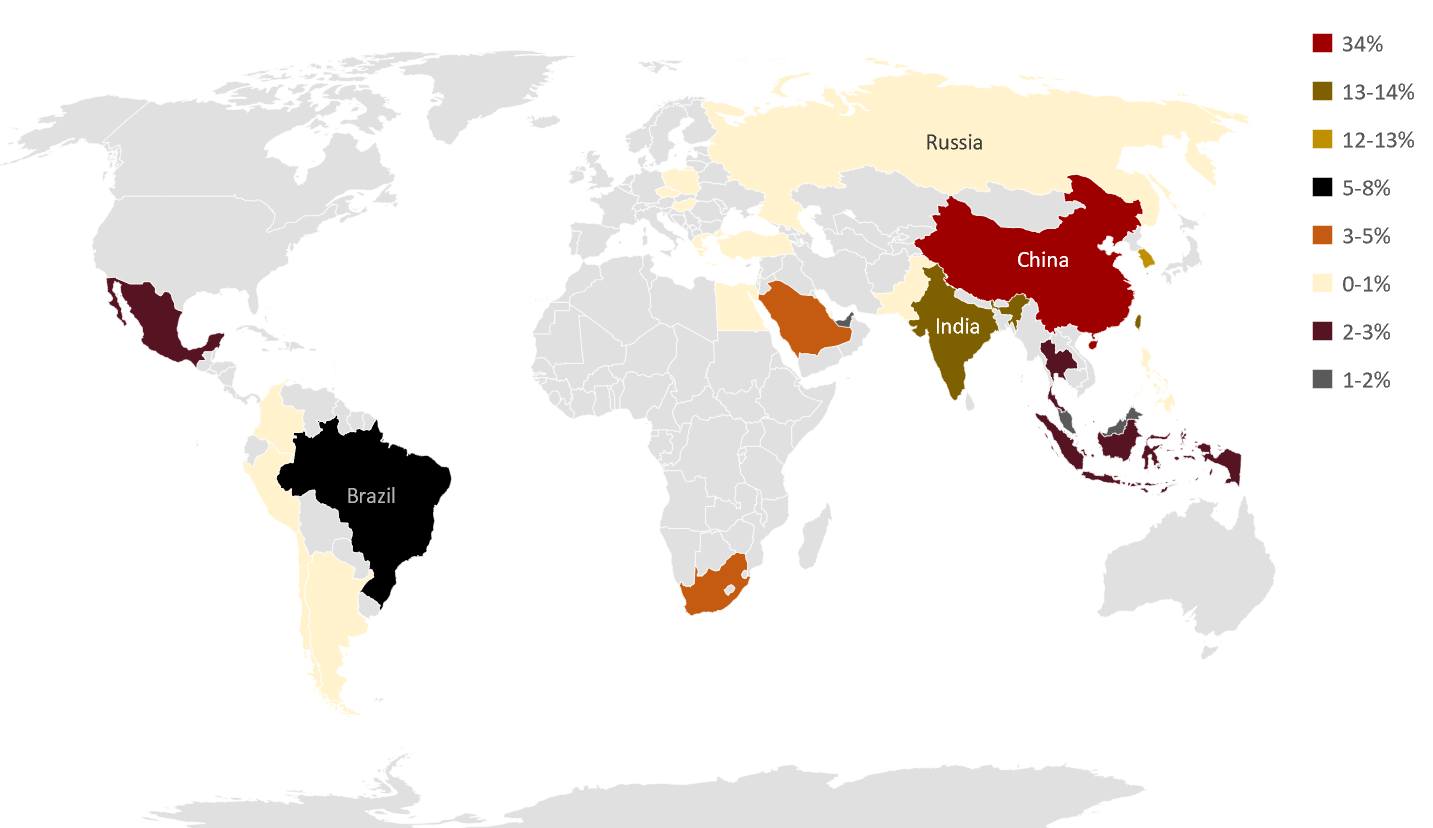
What is the relative share of key Markets in MSCI Emerging Markets Index?
While Chinese Stocks represent around 4% of World Equities, they represent over 34% of Emerging Market Stock Market Capitalisation. This proportion dropped from over 40% in Q1 2020. Other key markets include:
- Taiwan – remained stable at c. 13% over the past three years.
- India – relative exposure increased from 8% to 13% since Q1’20.
- South Korea – relative exposure marginally increased from 11% to 12%.
- Brazil – with c. 8% allocation
Russia dropped from most Indices, following the invasion of Ukraine. Marginal contributors include countries such as South Africa, Mexico, or Indonesia.
Investing in Frontier Markets
How Can I access Frontier Markets?
Frontier Markets are tiny and not represented in Global Indices like the MSCI ACWI Index. To get exposure to markets such as Morocco or Vietnam, you need an ETF tracking the MSCI Frontier Markets Index. It’s a niche area of investing.
What is the MSCI Frontier Markets Index?
This index is designed to represent the performance of equities in frontier markets, which are countries that have smaller economies or less developed capital markets than traditional emerging markets. The MSCI Frontier Markets Index captures large and mid-cap representation across 34 Frontier Markets countries. It provides a comprehensive benchmark for investors looking to invest in these less mature markets, which often exhibit different growth dynamics and risk profiles than more established markets.
Does company size matter?
Now that you’ve decided which markets to exposure to, the next decision is what size of companies your ETF will be exposed to.
- If you want to limit yourself to large and medium-sized companies – choose the simple Index sames that don’t have words like ‘IMI’ or ‘All cap’. Examples include MSCI ACWI or FTSE ALL-WORLD.
- To include small caps – you need to select a broader index such as MSCI IMI or FTSE All Cap Index.
Equity Indices by company size according to MSCI
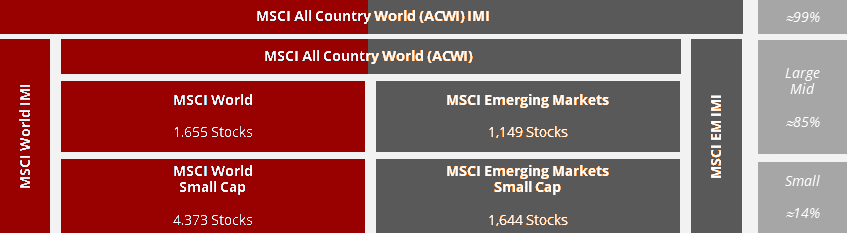
What part of MSCI ACWI or MSCI World is represented by Large and Medium Sized companies?
Large and Mid-Caps whether part of MSCI ACWI or MSCI World cover 85% of World Stock Market Capitalization. Should you wish to include Small Caps this coverage increases by 14% to account for 99% or all Stocks. Micro Caps, which represent the 1%, are excluded.
Why should You get Exposure To All Small Caps?
As you can see in the below tables, most UCITS ETFs have low exposure to small caps. The exceptions are MSCI IMI or FTSE ALL CAP Indices, which benefit from full diversification and convenience. But it’s not as useful as some investors may think. Here is why.
Why should You Not get Exposure To All Small Caps?
But, if you don’t have access to the MSCI IMI or FTSE All Cap Series, your portfolio may be even more efficient from a risk-adjusted return perspective. Small Cap universe comprises Small Cap Value and Small Cap Growth Stocks. However, only Small Cap Value have historically outperformed the broader market:
- Small Cap Growth Stocks are often labelled as the black hole of investing or simply ‘junk’, as explained by AQR1. These stocks lose money in the long run, even if they can be overvalued in the short term, since they are e.g. difficult to short.
- Only Small Cap Value/Quality Stocks may provide incremental returns to your portfolio, so adding them separately, while more cumbersome, could be more efficient.
Does the index provider matter?
What are the differences between MSCI and FTSE?
Now that I have covered how MSCI Indices work, let’s have a quick comparison with FTSE. For a long-term investor covering the entire market, differences are marginal, but try to be consistent when you invest gradually, e.g. try not to mix the two. Here is why.
Do MSCI and FTSE treat countries differently?
Both providers have different methodologies. If you mix the indices, you may invest in Korea or Poland twice or not at all:
- Poland and South Korea – The providers classify certain countries differently – For example, FTSE indexes classify South Korea or Poland as developed markets, while MSCI considers them as emerging markets.
- Providers may treat China differently – MSCI has been feeding Chinese A-shares since June 2018 and increased the 5% cap over time. FTSE introduced these companies a year later and has a 5.5% cap. While today both providers reflect China at 34% in Emerging Markets Indices, this could change in the future.
Do MSCI and FTSE Include the Same Number of Small Caps?
- Main MSCI indices capture 85% of total market cap – the non-IMI series excludes the bottom 15% (small-cap firms). MSCI ACWI comprises 2,885 companies as of January 2023.
- FTSE global indices track 90% of total market cap – the non-All Cap series excludes the bottom 10% of small-cap firms. FTSE All-World comprises 4,151 companies as of January 2023. Note, that Vanguard models the exposure on about 3,700 companies.
This difference disappears if you invest in MSCI IMI Series or FTSE ALL Cap Series, which both cover small caps, too.
How are FTSE Indices structured?
FTSE Structure is similar to MSCI, but naming convention varies.
Equity Indices by company size according to FTSE
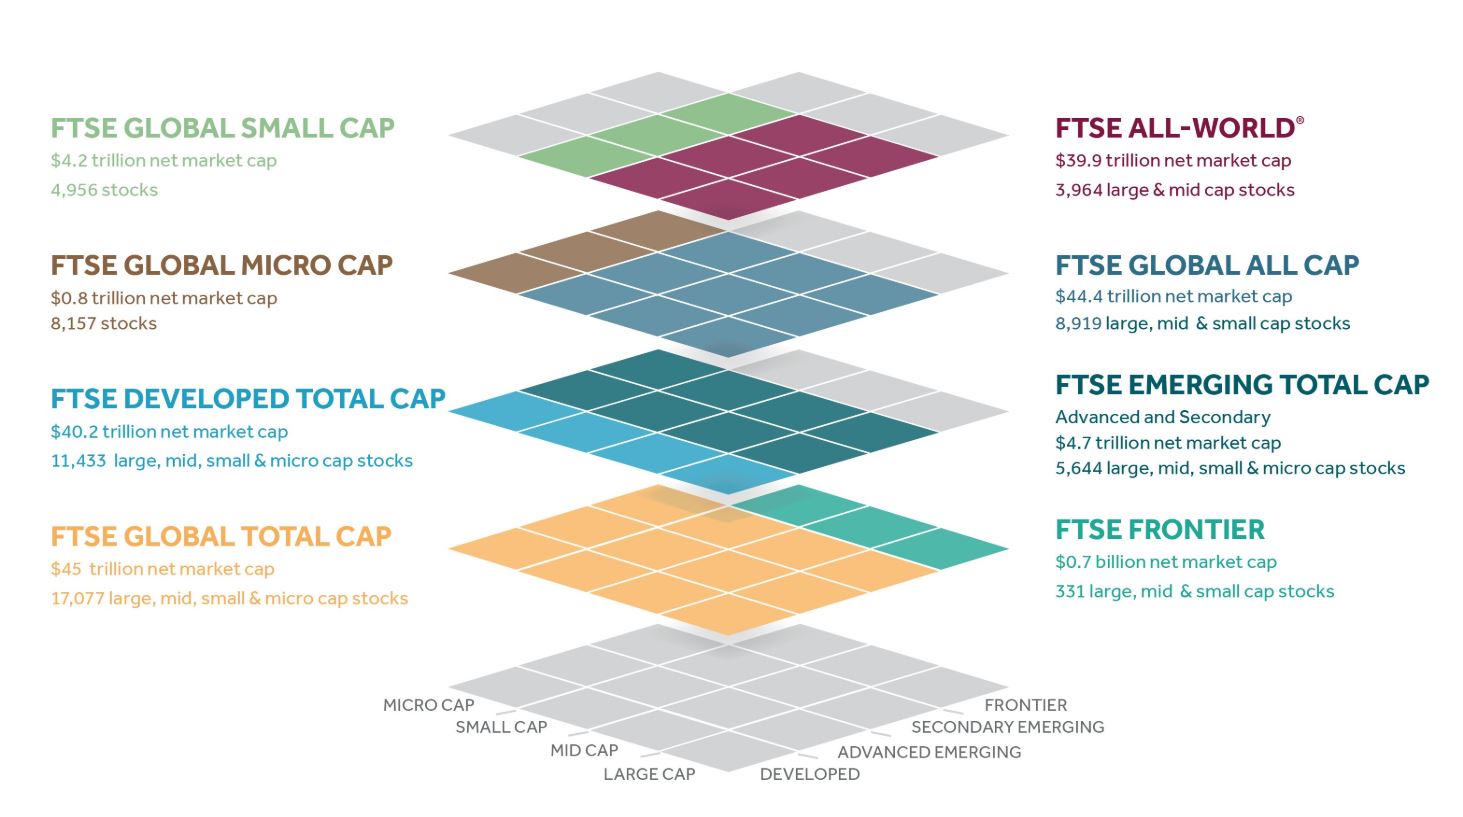
For example, let’s have a look at the FTSE All-World Index.
what is FTSE all-world index?
The main FTSE index that captures global stock markets, including both developed and emerging markets, is the “FTSE All-World Index.” This index is designed to represent the performance of the large and mid-cap stocks globally. It covers both developed and emerging markets, thus providing a comprehensive picture of global stock market performance. The FTSE All-World Index is widely used by investors as a benchmark for global equities and as the basis for a range of financial products, including mutual funds and ETFs, that aim to replicate global market performance.
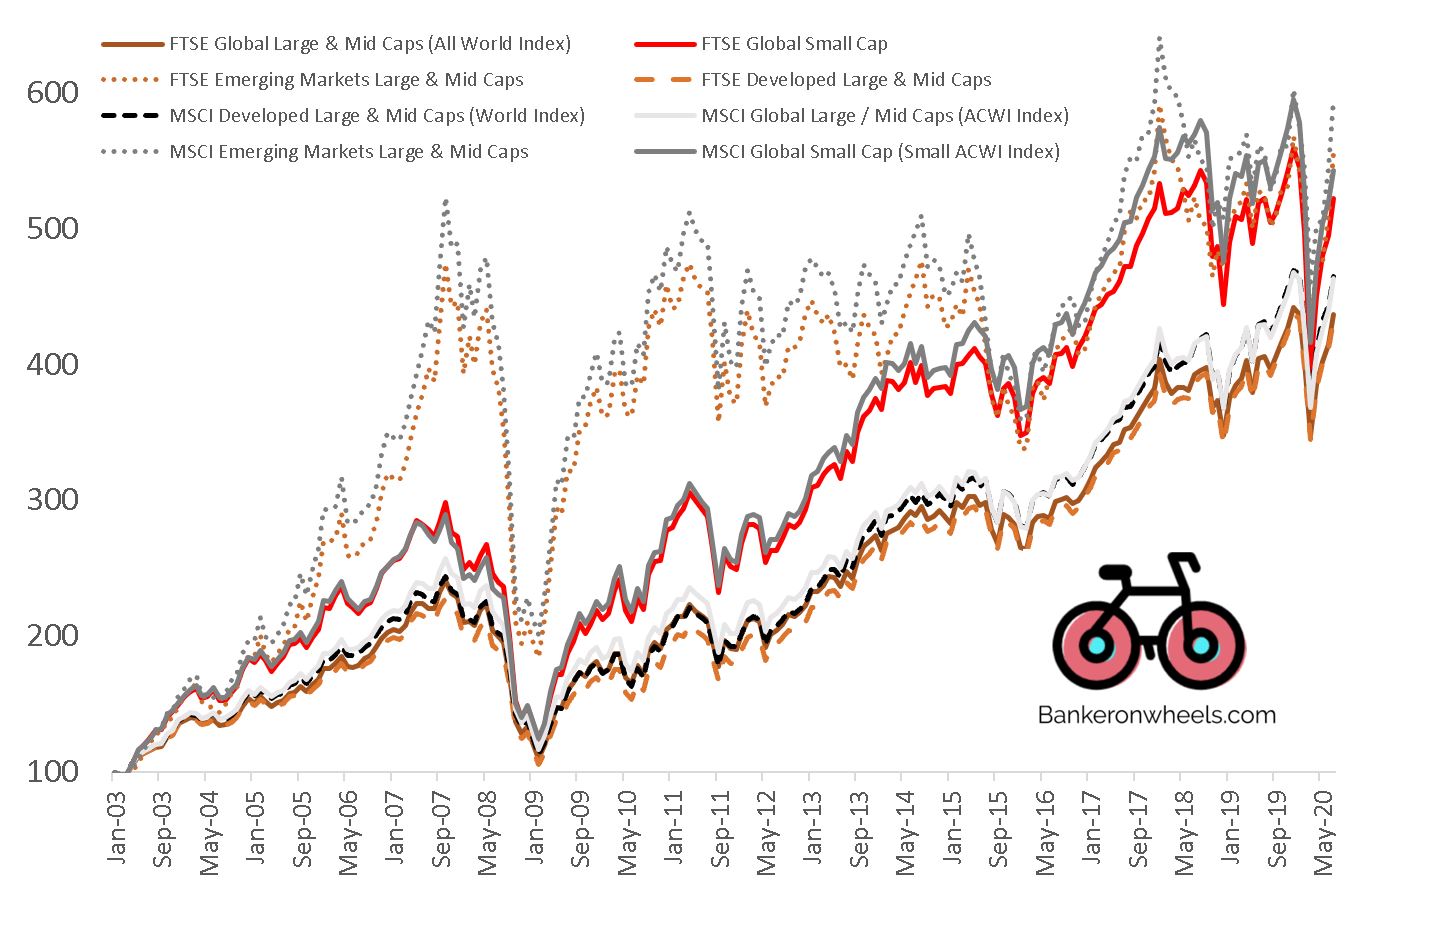
MSCI vs FTSE - Which Index Provider Is best?
The difference between both providers is currently negligible, as MSCI and FTSE are very highly correlated, despite minor methodology differences. What matters is to keep consistency within your portfolio, as provider methodologies may change, and not to mix providers.
Total Returns of Key MSCI & FTSE Indices
What is Solactive?
Solactive is a European provider that has emerged as a fresh contender in the world of financial benchmarks. Established in 2007, it’s a relatively new entrant but has set its sights high, aiming to challenge MSCI and FTSE. By offering cost-effective, tailor-made indices with a focus on innovation and technology, Solactive seeks to carve out its niche and redefine the landscape of index solutions for global investors.
Solactive treats Poland as a Developed Market, while South Korea is an Emerging Market. Their standard Large & Mid-Cap Indices capture 85% of the overall Market Cap.
Summary of key benchmarks
Now, let’s recap all the characteristics we covered. Below are key ETF Benchmarks for key Index Providers.
What are the main MSCI Indices?
KEy MSCI Benchmarks
| INDEX | MARKET | COMPANY SIZE | |||
|---|---|---|---|---|---|
| Series | DM | EM | Large | Mid | Small |
| MSCI All Country World IMI (ACWI IMI) | ✓ | ✓ | ✓ | ✓ | ✓ |
| MSCI All Country World (ACWI) | ✓ | ✓ | ✓ | ✓ | |
| MSCI World IMI | ✓ | ✓ | ✓ | ✓ | |
| MSCI World | ✓ | ✓ | ✓ | ||
| MSCI World Small Cap | ✓ | ✓ | |||
| MSCI Emerging Markets IMI | ✓ | ✓ | ✓ | ✓ | |
| MSCI Emerging Markets | ✓ | ✓ | ✓ | ||
| MSCI Emerging Markets Small Cap | ✓ | ✓ | |||
What are the main FTSE Indices?
Key FTSE Benchmarks
| INDEX | MARKET | COMPANY SIZE | |||
|---|---|---|---|---|---|
| Series | DM | EM | Large | Mid | Small |
| FTSE Global All Cap | ✓ | ✓ | ✓ | ✓ | ✓ |
| FTSE All World | ✓ | ✓ | ✓ | ✓ | |
| FTSE Developed All Cap | ✓ | ✓ | ✓ | ✓ | |
| FTSE Developed | ✓ | ✓ | ✓ | ||
| FTSE Emerging All Cap | ✓ | ✓ | ✓ | ✓ | |
| FTSE Emerging | ✓ | ✓ | ✓ | ||
What are the main Solactive Indices?
Key Solactive Benchmarks
| INDEX | MARKET | COMPANY SIZE | |||
|---|---|---|---|---|---|
| Series | DM | EM | Large | Mid | Small |
| Solactive GBS Global Markets All Cap | ✓ | ✓ | ✓ | ✓ | ✓ |
| Solactive GBS Global Markets Large & Mid Cap | ✓ | ✓ | ✓ | ✓ | |
| Solactive GBS Developed Markets All Cap | ✓ | ✓ | ✓ | ✓ | |
| Solactive GBS Developed Markets Large & Mid Cap | ✓ | ✓ | ✓ | ||
| Solactive GBS Emerging Markets Large & Mid Cap | ✓ | ✓ | ✓ | ||
KEY CONSIDERATIONS
What is the difference between MSCI ACWI and MSCI World?
The MSCI ACWI offers a broader representation of global equity markets, encompassing both developed and emerging markets from 47 countries. This includes notable emerging markets like China and India. On the other hand, the MSCI World focuses solely on 23 developed countries, with a significant influence from US companies due to market capitalization weighting. Both indices emphasize sector diversification, with Information Technology leading in both. Historically, the MSCI World has outperformed the MSCI ACWI, but this is driven by recent outperformance of the US and doesn’t guarantee future results.
how much emerging markets allocation should i have?
If you’re adhering to the principles of simplicity, broad diversification, and staying the course, the allocation to emerging markets would typically be based on their global market capitalization. Historically, emerging markets have represented around 10-15% of the global stock market capitalization. Therefore, if you’re aiming for a market-weighted global portfolio, an allocation of 10-15% to emerging markets would be in line with this philosophy. However, individual circumstances, risk tolerance, and investment goals can influence this allocation.
What are International ETFs?
US Investors tend to classify ‘International ETFs’ Exchange Traded Funds with Stocks outside the US. These ETFs encapsulate equities from developed, emerging, or even frontier markets. For those seeking diversification, international ETFs are indispensable.
how much international exposure Should I have?
If you are based in the US and emphasize simplicity, broad diversification, and a long-term view, the allocation to international markets should mirror the global market capitalization. In recent history, U.S. stocks have represented around 50-60% of the global market capitalization, with international stocks making up the remainder. Currently, an approach might suggest an international allocation of 40-50% of your equity portfolio. However, many US Investors have a domestic bias and allocate 20-40% to international equities. It’s essential to consider your risk tolerance, time horizon, and individual circumstances.
RECOMMENDED ETFs FOR MOST EUROPEAN & UK INVESTORS
Below are some recommended allocation guides and ETFs.
How Can EU and UK Investors control their regional allocations?
European Investors have several options, including the following:
- Global Exposure ETFs – If you want to hold all of your Global equities in one fund, there are at least 6 leading UCITS ETFs that give you global exposure within a single ETF. Have a look at how to invest through a Global UCITS ETF.
- European and Asian Developed Markets ETFs – If you want to carve out the U.S. and Canada from other Developed Markets, here are some options on how to invest in European and Asian Developed Markets.
- S&P 500 ETFs – For Europeans, having exposure to U.S. Markets through synthetic ETFs may have tax advantages. Here is how to invest through synthetic ETFs.
RECOMMENDED ETFs FOR US INVESTORS
What Are the best non-UCITS ETFs?
Some investors may directly invest in non-UCITS ETFs:
- US Investors
- Elective European Professional Broker Clients
- Certain European Countries like Switzerland
Below are ETFs that provide investors global exposure, assuming you already invest in USA Markets separately, within a single ETF.
What Are Best non-UCITS ETFs?
| Exposure | Index | ETF | Ticker |
|---|---|---|---|
| Global | FTSE Global All Cap | Vanguard Total World Stock ETF | VT |
| Global | MSCI ACWI IMI | SPDR MSCI ACWI IMI ETF | ACIM |
| Global | MSCI ACWI | iShares MSCI ACWI ETF(ACWI) | ACWI |
| Global ex-US | FTSE Global All Cap ex-US | Vanguard Total International Stock ETF | VXUS |
| Global ex-US | MSCI ACWI IMI ex-US | iShares Core MSCI Total International Stock ETF | IXUS |
| Global ex-US | MSCI ACWI ex-US | iShares MSCI ACWI ex U.S. ETF | ACWX |
| Developed Markets ex-US | FTSE Developed Markets All Cap | Vanguard Developed Markets ETF | VEA |
| Developed Markets ex-US | FTSE Developed ex US | Schwab International Equity ETF | SCHF |
| Developed Markets ex-North America | MSCI EAFE | iShares Core MSCI EAFE ETF | IEFA |
| Emerging Markets | FTSE Emerging Markets All Cap | Vanguard Emerging Markets ETF | VWO |
| Emerging Markets | MSCI Emerging Markets IMI | iShares Core (MSCI IMI) Emerging Markets ETF | IEMG |
| Emerging Markets | MSCI Emerging Markets | iShares Emerging Markets ETF | EEM |
From Bankeronwheels.com
Get Wise The Most Relevant Independent Weekly Insights For Individual Investors In Europe & the UK
Liked the quality of our guides? There is more. Every week we release new guides, tools and compile the best insights from all corners of the web related to investing, early retirement & lifestyle along with exclusive articles, and way more. Probably the best newsletter for Individual Investors in Europe and the UK. Try it. Feel free to unsubscribe at any time.
🎁 In the first email, you can download a FREE comprehensive 2-page checklist to construct & monitor your portfolio and clean up your personal finances.
Next Steps
Some of our readers like to implement tilts towards markets that are cheaper, for example in Europe or Asia. If implementing a tilt can make overall valuations more bearable for some investors so that they can stick to their strategy in the long run, it may be a sin worth pursuing.
Read how you may think of implementing it.
Good Luck and Keep’em* Rolling!
(* Wheels & Dividends)


Surviving The Next Bear – Strategies To Profit From The Next Market Crash


Weekend Reading – Asset Class Returns since 1970 & Trend Following Strategies


Cracking the Code: Decoding ETF Names & Discovering Tools To Find Them

Broker Review Methodology


iWeb Share Dealing Review – Great For Inactive Investors


AJBell Review – Leading Broker & Low-Fee SIPP Provider
HELP US
🙋 Wondering why finding honest Investing Guidance is so difficult? That’s because running an independent website like ours is very hard work. If You Found Value In Our Content And Wish To Support Our Mission To Help Others, Consider:
- 📞 setting up a coaching session
- ☕ Treating us to a coffee
- 🎁 Taking advantage of our affiliate links when setting up a broker account. This doesn’t increase your costs, and we often secure exclusive bonuses for our audience.
- ❤️ Exploring Other ways to support our growth, both financially and non-financially.
DISCLAIMER
All information found here, including any ideas, opinions, views, predictions expressed or implied herein, are for informational, entertainment or educational purposes only and do not constitute financial advice. Consider the appropriateness of the information having regard to your objectives, financial situation and needs, and seek professional advice where appropriate. Read our full terms and conditions.