The Long Game – Historical Market Returns & 2023 Expectations
The Long Game - Historical Market Returns and 2023 Expectations
Today's Pain, Tomorrow's Gain
It’s the humbling time of the year to acknowledge the limits of our ability to predict markets and amend our financial plans for 2023.
2022 reminded us that trees don’t grow to the sky.
But for Bonds or Equities, today’s losses mean higher returns tomorrow.
The past decade also became representative of reasonable long-term investing expectations.
Since 2013, World Equities have gained over 185% and returned 6.4% annually.
What about undervalued sectors?
International Stocks and Small Caps look attractive, but while this is great for learning, remember the game’s rules and try to remain forecast-free.
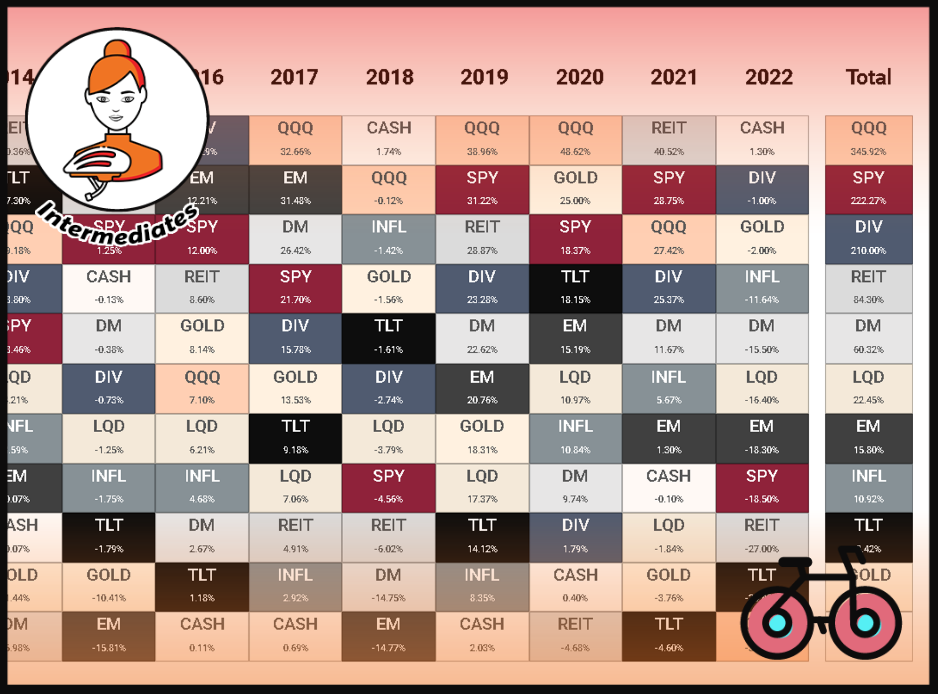
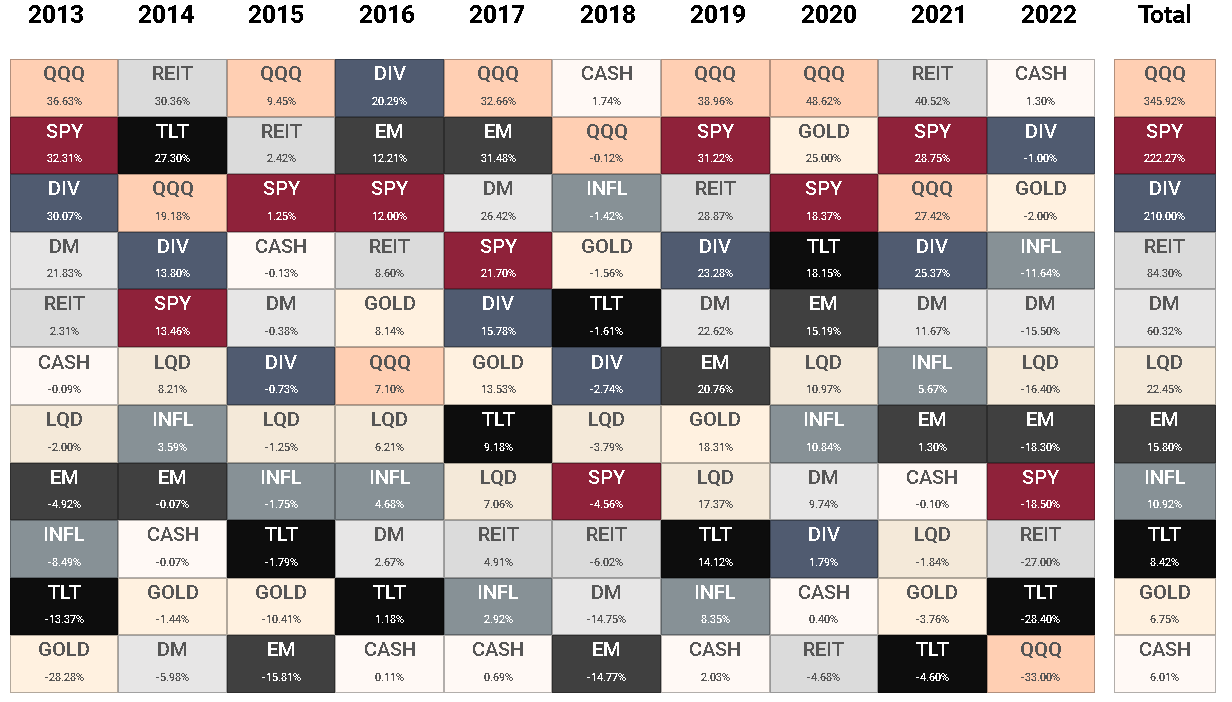
WHAT ARE THE BEST PERFORMERS OF THE PAST DECADE?
performance OF POPULAR FUNDS & 10-year CUMULATIVE RETURN
This chart is based on Total Net Returns in USD. The Total column represents cumulative performance over the past decade. CASH – Money Market Funds (BIL ETF), S&P – S&P 500 (SPY ETF), QQQ – NASDAQ 100 (QQQ ETF), DIV – Dividend Strategy (SDY ETF), DM – Developed Markets (VEA ETF), EM – Emerging Markets (VWO ETF), INFL – Inflation Protected US Treasury Bonds (TIP ETF), TLT – Long Duration US Treasury Bonds (TLT ETF), LQD – US Corporate Bonds (LQD ETF), GOLD - Spot. Source: Bloomberg, iShares.
2022 Stock Market Highlights
With Inflation of 8-11% across Europe and the US, the 2022 returns need to be taken with a pinch of salt.
The 60/40 Portfolio had one of the worst years at c. -23% (in Real USD). Its 2008 real return was -18%.
Gold price was stable, despite high inflation.Higher real interest rates didn’t help. Yes, Investing is hard.
Yet again, a stronger USD mitigated Europeans’ losses. EUR is down 7% YTD, while GBP lost 12%.
World Equity ETFs lostc. 18% in USD. But for Europeans the loss is 12%, while for UK investors it’s only 9%.
From Aug’20 to Oct’22, Long-term Treasuries experienced a record drawdown of -40%, triggered by the most aggressive FED hikes in history.
Dividend Investors had a great year. Now, more than ever, it may be even more challenging to convince them that this strategy is not superior but merely a reflection of risk factors.
Value Stocks, certain Trend-Following ETFs and Alternatives outperformed.
WHAT ARE THE WORST PERFORMERS OF 2022?
SELECT Volatile MARKETS
S&P 500’s drop of 19% hides steep declines beneath the surface led by Tesla -70% or Amazon -50%. TikTok or OpenAI challenged businesses like Meta -65%,or Google -38%.
As the tide went out, speculative market participants were seen swimming naked. The darling of the bull run – ARKK ETF – dropped 69%. Coinbase lost 85% and GameStop 50%.
Bitcoin trades lower than a couple of years ago after losing 65% this year. Bitcoin’s Market Cap is now 5% of Gold’s.
Crypto Industry’s Market Cap dropped by $2 trillion from its peak, including FTX and Terra, for which $30 billion were wipeout in a record 24 hours.
But Blockchain is here to stay. One hundred fourteen nations currently consider some form of Central Bank Digital Currency.
❤️🐶 Shop & Support - Celebrate our 4th anniversary! 4️⃣🎂
Spread the Golden Retriever Wisdom Across Europe & the UK 😎
Banker On Wheels is 4 years old! To celebrate our anniversary we have launched the official merchandise store – Shop.Bankeronwheels.com. You can now get your favourite Golden Retriever, or your factor tilt on a coffee mug or a T-Shirt while supporting our cause! All profits are reinvested into creating more educational content. Alternatively, you can also buy us a coffee. Thank you for all your support ❤️
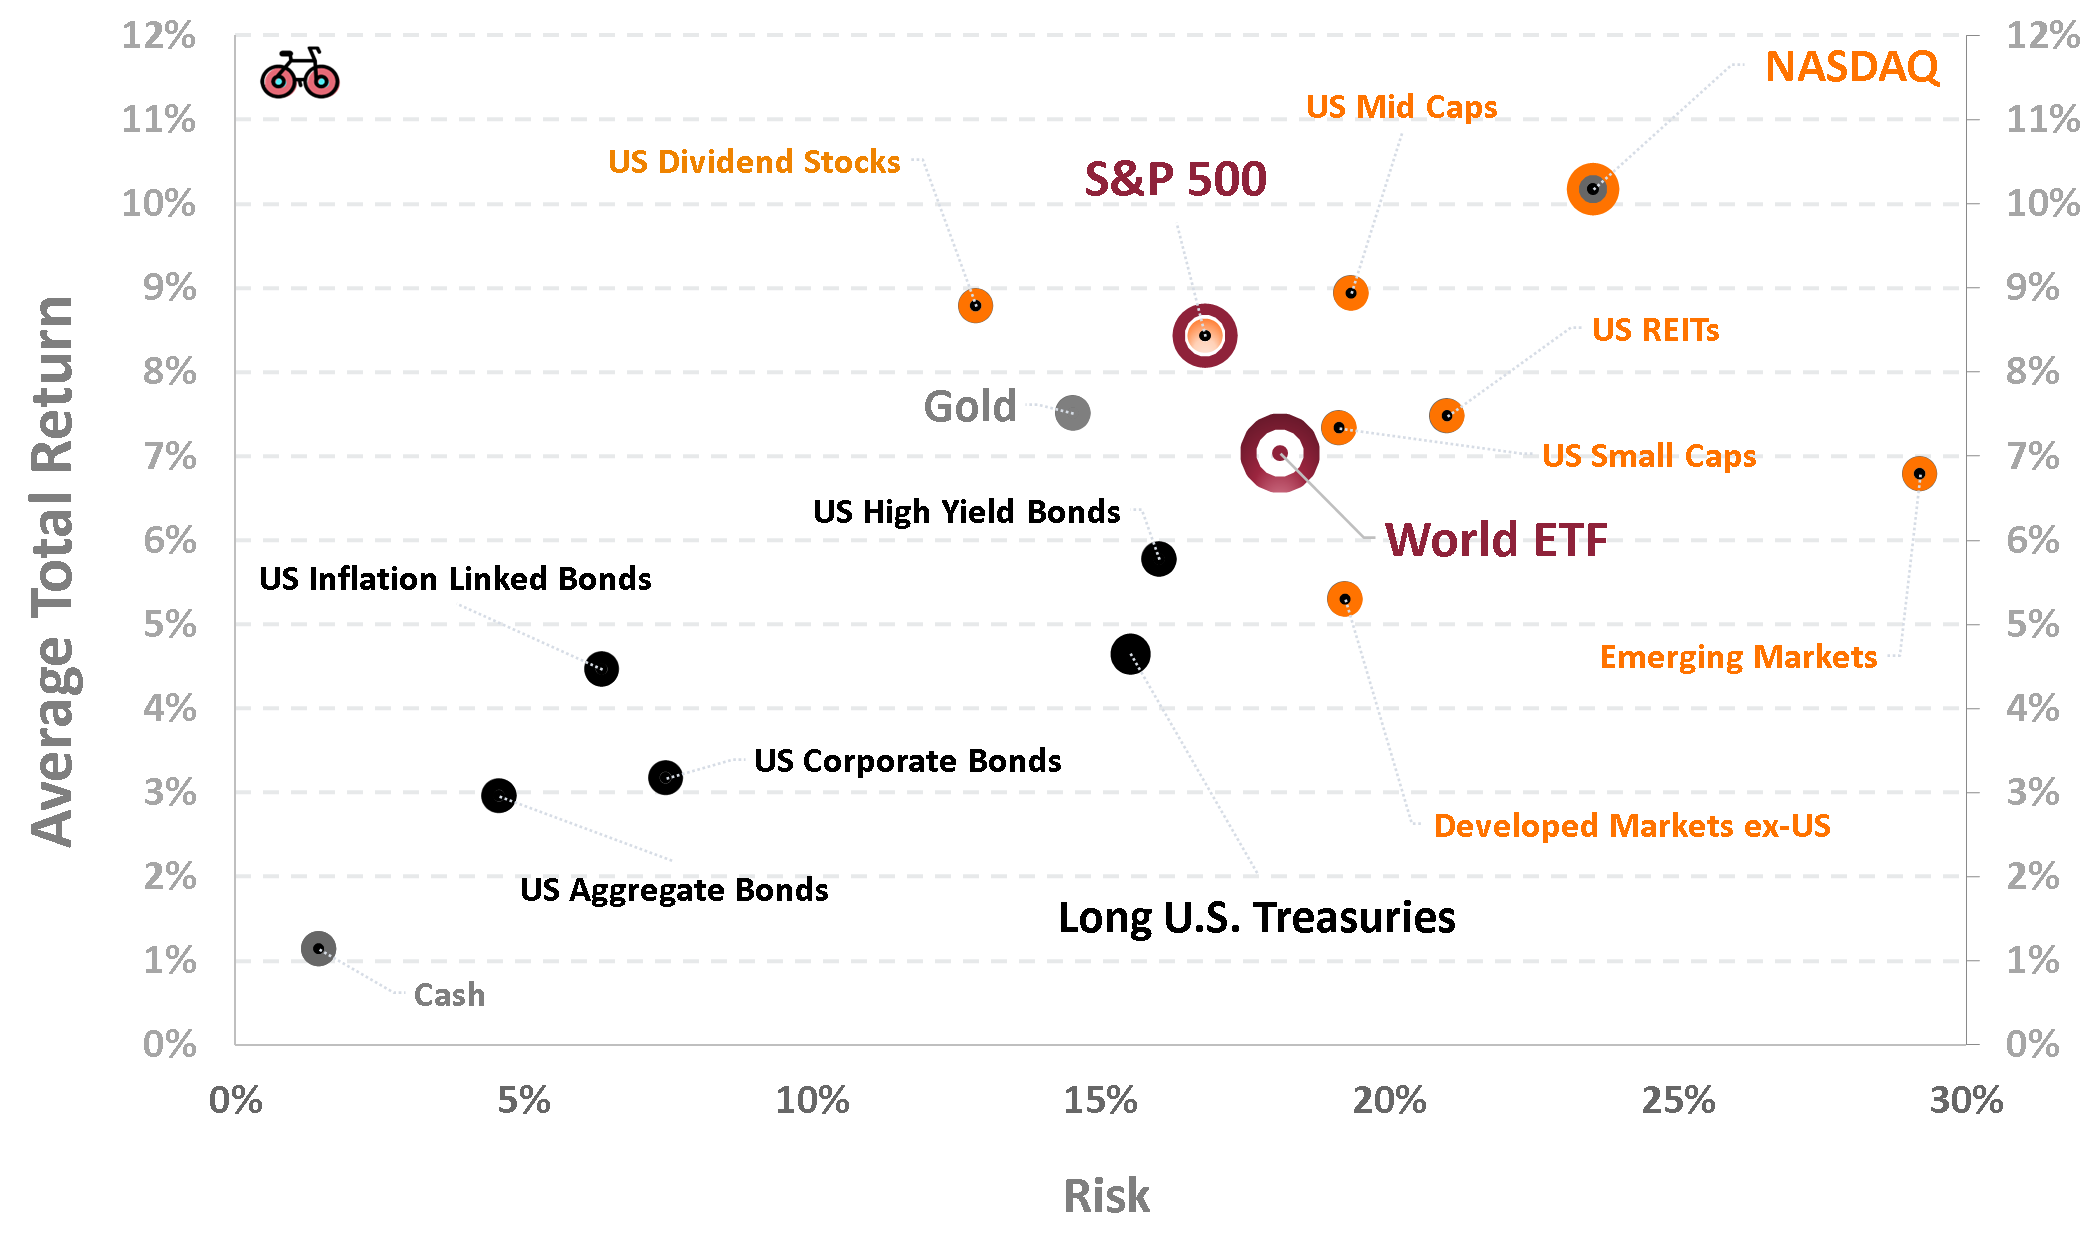
It’s helpful to look at the risk-adjusted returns.
But it’s even more important to tailor portfolio risks to your circumstances:
Hedge Your Unique Risks – Standard deviation has a lot of limits, but at least provides ballpark annual declines. Most importantly, choose assets depending on your situation and exposure to your unique life risks (e.g. cyclical job, being near retirement).
Protect Your Downside – Treasuries exhibited historical volatility, but Standard Deviation doesn’t tell the whole story. Bonds hedged nicely during both GFC and COVID-19 downturns.
Don’t look (too much) in the rearview mirror – US Stocks remained the best historical risk-adjusted asset class. Most back-testing toolsfrequently overweight them in portfolios. But remember, history doesn’t crawl. It leaps.
Think long-term – For example, don’t excludeEuropean and Japanese Stocks, which have the highest dividend premium of 2% vs. the US in 20 years. Itmay contribute to outperformance, especially if the USD weakens. Look how International Stocks caught up in the past.
Advertisement
Advertisement
DID INFLATION PROTECTION WORK?
When I wrote a guide about Bear Markets over two years ago, inflation wasn’t on the table, and no one was talking about the 70s. Yet, this is what I envisaged as the worst-case bear market scenario.
Bogle noted that you could, reasonably, predict stock market returns with three inputs:
The initial dividend yield on the stock market
The predicted change in Price/Earnings (P/E) ratio
An estimate of earnings growth
Let’s look at why today’s lower levels mean that, while Equities still not cheap, the upside is better, compared to last year.
The only weaker outlook, relates to earnings.
1. Dividend Yield
In Q4’21, the Initial S&P 500 Dividend Yield stood at some historical lows – around 1.2%.
In Q4’22, this yield is higher, at 1.7%. But S&P 500 dividends are still well below historical levels (median 2.35%). So based on dividend yield alone, the expected return in the long run are just marginally higher.
2021
2022
1. Dividend Yield
In Q4’21, the Initial S&P 500 Dividend Yield stood at some historical lows – around 1.2%.
In Q4’22, this yield is higher, at 1.7%. But S&P 500 dividends are still well below historical levels (median 2.35%).
So based on dividend yield alone, the expected return in the long run are just marginally higher.
2021
2022
2. change In P/E Ratio
The P/E ratio is the most significant driver of stock returns. In Q4’21, the S&P 500 traded at a forward ratio of 23x.
In Q3’22, this ratio stands at 15x, just below the historical average (16.8x). It’s more reasonable to assume positive change in the long run. But, in the short to medium term, P/E ratios have room to fall even further during recessions.
2021
2022
2. change In P/E Ratio
The P/E ratio is the most significant driver of stock returns. In Q4’21, the S&P 500 traded at a forward ratio of 23x.
In Q3’22, this ratio stands at 15x, just below historical average (16.8x). It’s more reasonable to assume positive change in thelong run. But, in theshort to medium term, P/E ratios have room to fall even further during recessions.
2021
2022
3. Earnings Growth
By historical standards, 2021 Earnings Growth of 70% was spectacular. Think of Earnings Growth as two aspects (i) revenue growth and (ii) higher margins. Last year, margin growth explained 75% of the earnings growth.
In 2022, short to medium-term revenue growth is threatened on both counts. Pressure on Revenue Growth due to a global recession and margins due to e.g. higher labour costs.
2021
2022
Advertisement
As of 29/03/2024, Interactive Brokers offers rates up to 4.738% (GBP), 3.445% (EUR) and 4.83% (USD) on cash.
Advertisement
As of 29/03/2024, Interactive Brokers offers rates up to 4.738% (GBP), 3.445% (EUR) and 4.83% (USD) on cash.
SHOULD YOU BUY BONDS?
HOW TO PREDICT BOND RETURNS
As John C. Bogle noted, since 1926, the entry yield on the 10-year Treasury explained 92% of the annualized return an investor would have earned over the subsequent decade.
What does it mean for Investors?
UK Investors – Can expect 3.7% annual nominal return over the next 10 years. After accounting for expected inflation the yield is broadly 0%.
German Investors – Can expect 2.4% nominal returns and 0.2% after inflation.
US Investors – Can expect 3.9% nominal returns and 1.5% after inflation.
10-Year Yield For U.S., Japan And Select European Countries
As of December 26th 2022. Nominal yields. Source: Bloomberg
What Else Can Bonds Protect From?
In deflationary recessions, Bonds may be a life-saver. Remember, inflation was also very hypothetical just a couple of years ago.
Learn more about how Bond ETFs can lose value or rally using the Bond ETF Calculator.
Bonds' Attractiveness
Government Bonds become more fairly valued compared to last year, especially for core EU economies like France, or the UK. However, be mindful of over-exposure to South-European countries (that may experience volatility with Equities).
Corporate Bondscan also offer more attractive yield pick-up, and Investment Grade Companies are more protected against default risk than in the past recessions given stronger corporate balance sheets.
2021
2022
Bonds' Attractiveness
Government Bondsbecome more fairly valued compared to last year, especially for core EU economies like France, or the UK. However, be mindful of over-exposure to South-European countries (that may experience volatility with Equities).
Corporate Bonds can also offer more attractive yield pick-up, and Investment Grade Companies are more protected against default risk than in the past recessions given stronger corporate balance sheets.
2021
2022
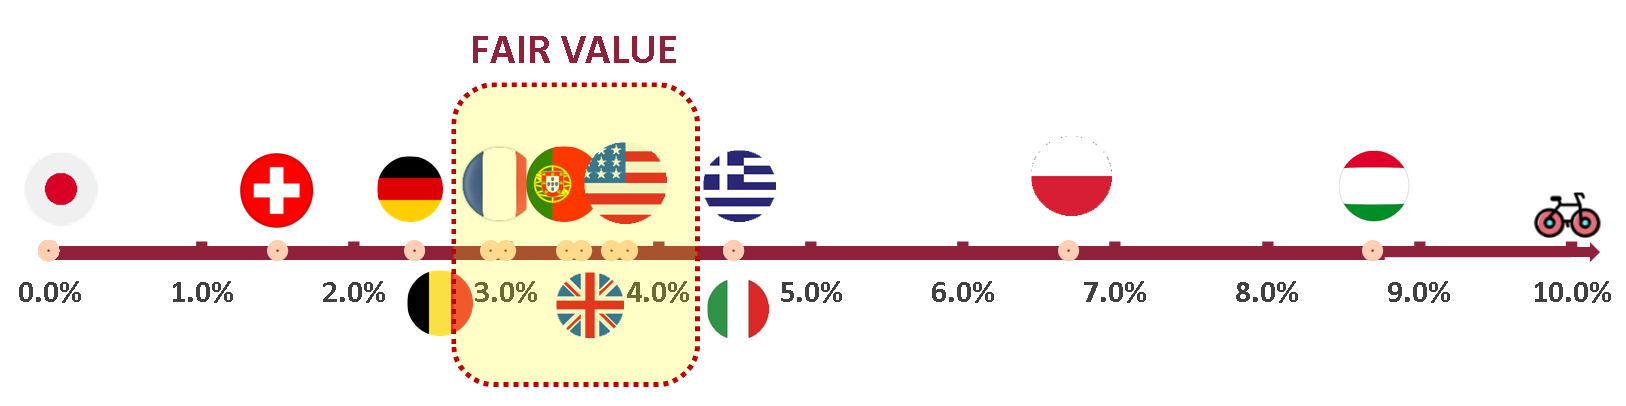
WHICH STOCKS ARE UNDERVALUED?
Europe, Japan and Emerging Markets vs. the U.S.
While we are cautious with any forecasts, many investors look at Vanguard’s for guidance.
According to their 2023 Outlook, in the next 10 years, Global ex-US Equities are expected to return 8.4% and outperform US Large Caps by c. 2.8% annually.
Why?
Four key factors drive it in Vanguard’s model:
Higher Dividends – are the biggest driver for ex-US Stocks that are expected to maintain a dividend yield of 3.3% (explaining 1.4% outperformance vs. the US).
Weakening US Dollar – given recent USD rally, a reversion to fair value means that ex-U.S. Stocks will outperform (1.2% outperformance vs. the US).
Valuation Catch up – ex-US Stocks trade at significant discount to US (0.9% outperformance vs. the US).
But Weaker Growth – US Earnings will still be stronger reducing the ex-US Outperformance (US to outperform by 0.7% year)
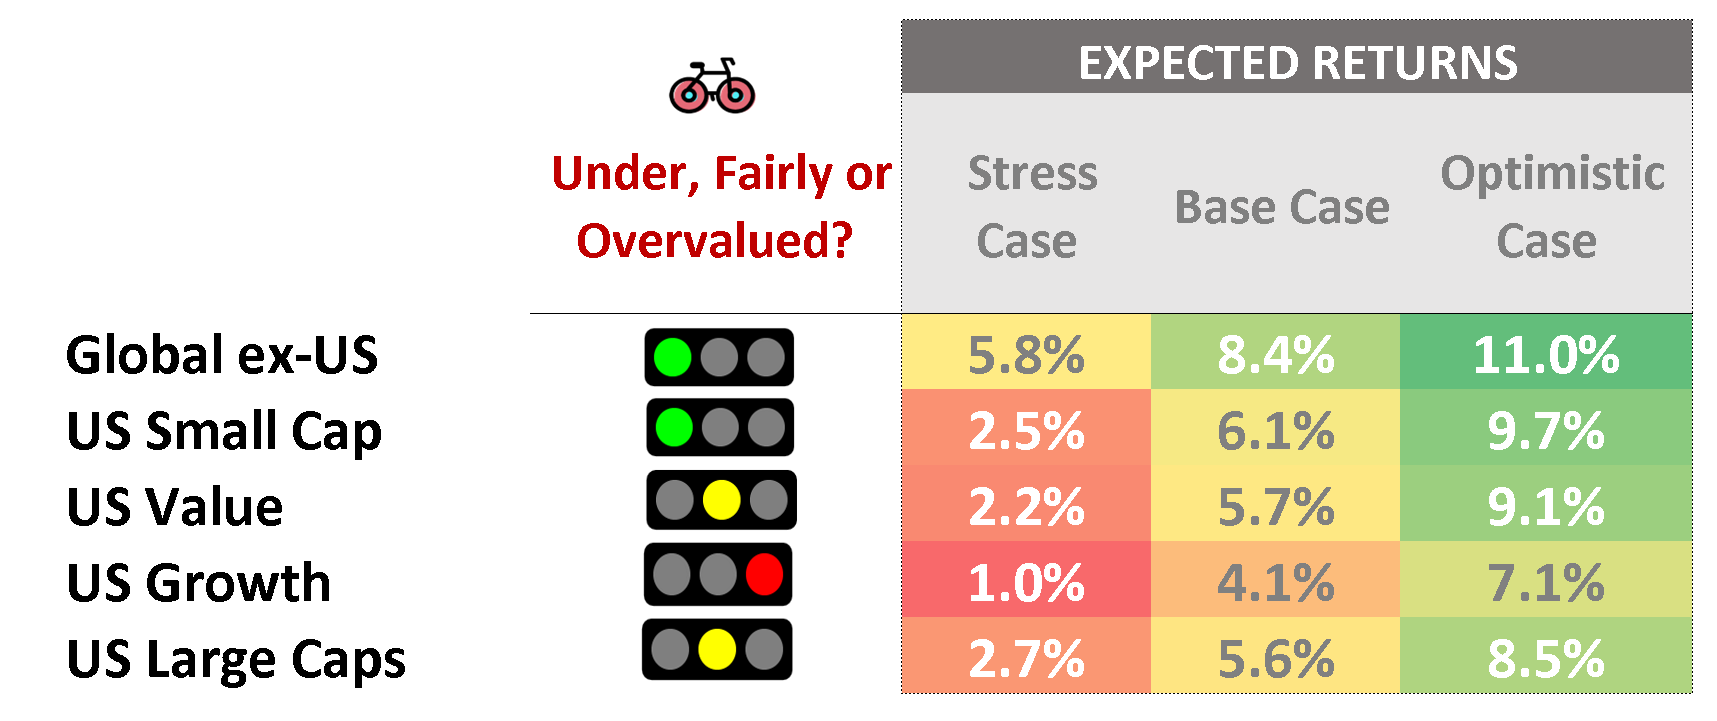
Small and Value Vs. Growth Stocks
The growth to value rotation that happened in 2022 will slow down but US Growth Stocks are still expected to underperform Value Stocks by 1.6% over the next decade.
Vanguard 10-YEAR Returns Expectations
Source: Vanguard. As of September 2022. Stress Case defined as Vanguard's 25% percentile, Optimistic Case defined as Vanguard's 75% percentile. With the exception of ex-U.S. markets, valuations are relative to U.S. equities as the base at the 50th percentile. Growth, value, and small-cap are all based on the percentile rank based on Vanguard's fair-value model relative to the market. Large-cap valuations are composite valuation measures of the style factor to U.S. relative valuations and the current U.S. cyclically adjusted price/earnings ratio (CAPE) percentile relative to its fair-value CAPE. Asset class returns do not take into account management fees and expenses, nor do they reflect the effect of taxes. Returns do reflect reinvestment of dividends and capital gains.
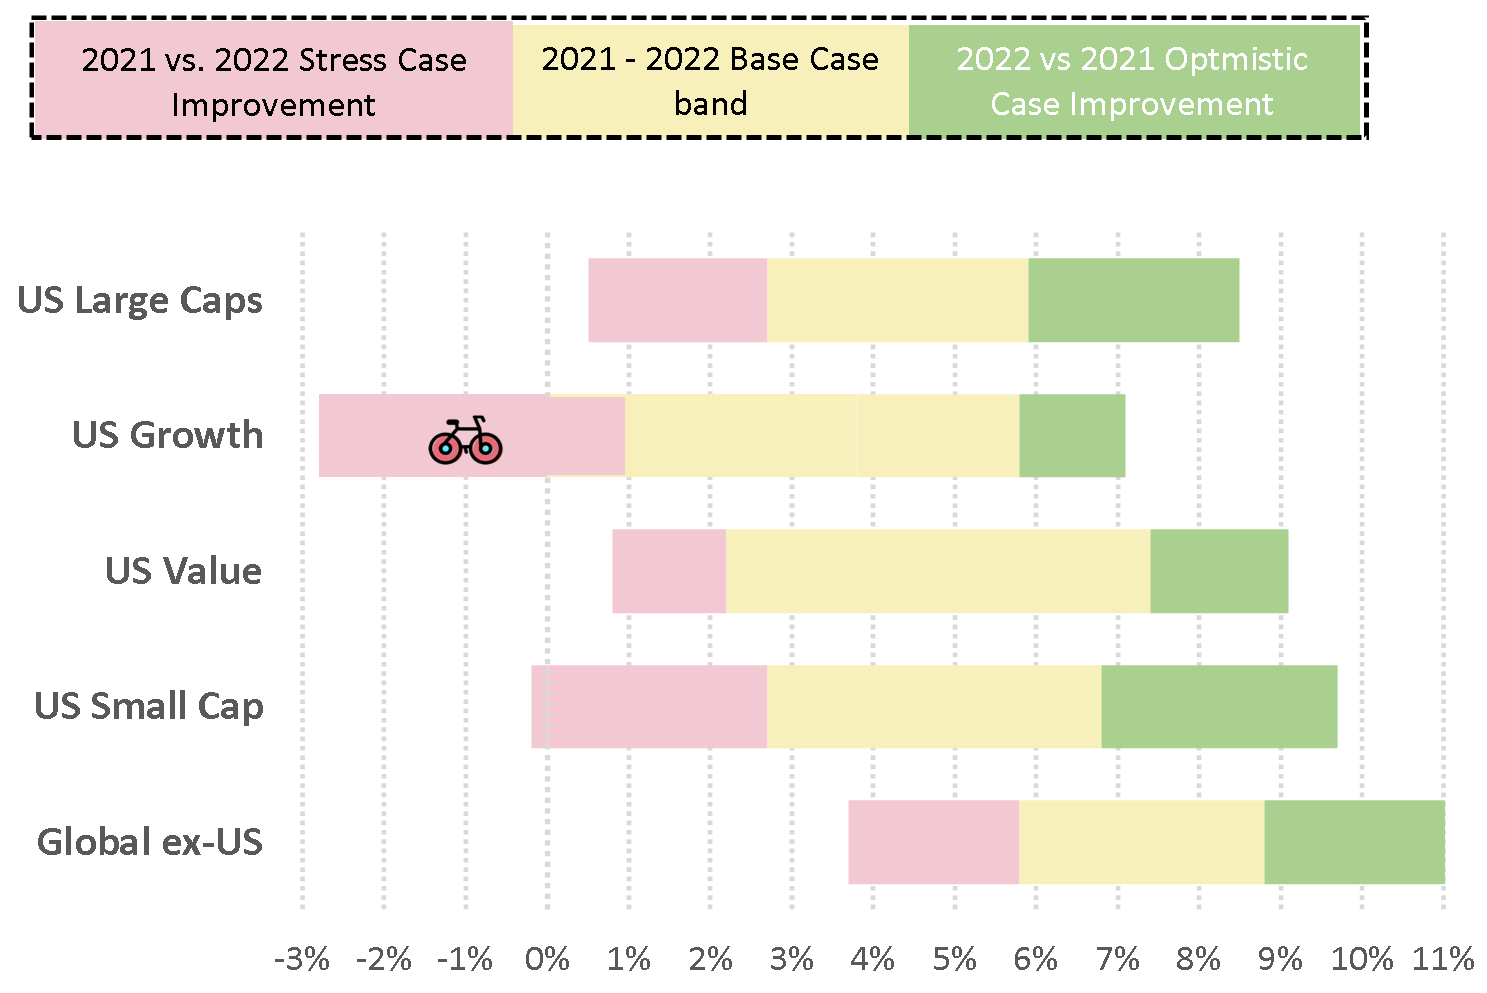
How did projections change over the past 12 months?
Given the drops in valuations, across all sectors, the outlook looks brighter:
Less downside for US Tech – Lowest expected return in Stress scenario reduced from -2.8% to +1%.
More upside for Small Caps – Lowest expected return in Optimistic scenario increased from 6.6% to 9.7%.
More upside for ex-US Stocks – Lowest expected return in Optimistic scenario went from 8.8% to 11% .
CHANGE IN Vanguard's 10-YEAR Expectations
Source: Vanguard economic and market outlook reports for 2023 and 2022. Stress Case defined as Vanguard's 25% percentile, Optimistic Case defined as Vanguard's 75% percentile. The forecast corresponds to the distribution of 10,000 Vanguard's VCMM simulations for 10-year annualized nominal returns in USD. Asset class returns do not take into account management fees and expenses, nor do they reflect the effect of taxes. Returns do reflect reinvestment of dividends and capital gains.
From Bankeronwheels.com
Get Wise The Most Relevant Independent Weekly Insights For Individual Investors In Europe & the UK
Liked the quality of our guides? There is more. Every week we release new guides, tools and compile the best insights from all corners of the web related to investing, early retirement & lifestyle along with exclusive articles, and way more. Probably the best newsletter for Individual Investors in Europe and the UK. Try it. Feel free to unsubscribe at any time.
🎁 In the first email, you candownload a FREE comprehensive 2-page checklist to construct & monitor your portfolio and clean up your personal finances.
HOW SHOULD YOU INVEST IN 2023?
Adjusting a portfolio to your circumstances is more important than to your market views:
Are you a young worker in a growing sector with labor shortages, based in France, where you locked in a 20-year mortgage at 2%? You may be in a situation to take more risks.
Are you near retirement and prolonged rising costs may derail your plans? Maybe you should consider more inflation protection.
If you consider any tilts, e.g. Small Cap Value or Emerging Markets, remember the limits of mean-reverting models, like Vanguard’s, and your ability to outperform.
🙋 Wondering why finding honest Investing Guidance is so difficult? That’s because running an independent website like ours is very hard work. If You Found Value In Our Content And Wish To Support Our Mission To Help Others, Consider:
❤️ Exploring Other ways to support our growth, both financially and non-financially.
DISCLAIMER
All information found here, including any ideas, opinions, views, predictions expressed or implied herein, are for informational, entertainment or educational purposes only and do not constitute financial advice. Consider the appropriateness of the information having regard to your objectives, financial situation and needs, and seek professional advice where appropriate.Read our full terms and conditions.
Get Wise The Most Relevant Independent Weekly Insights For Individual Investors In Europe & the UK
Dive deep into top-tier investment strategies, exclusive tools, and lifestyle insights. Every week, we release meticulously researched guides, hand-pick resources from all corners of the web, and tools that you won’t find elsewhere.
Probably the best newsletter for Individual Investors in Europe and the UK.
But don’t just take our word for it—experience it yourself. And if it’s not for you? Unsubscribing is just a click away.
🎁 In the first email, you candownload a FREE comprehensive 2-page checklist to construct & monitor your portfolio and clean up your personal finances.