Buying the S&P 500 today? Wait. These 7 Graphs Might Change Your Mind.
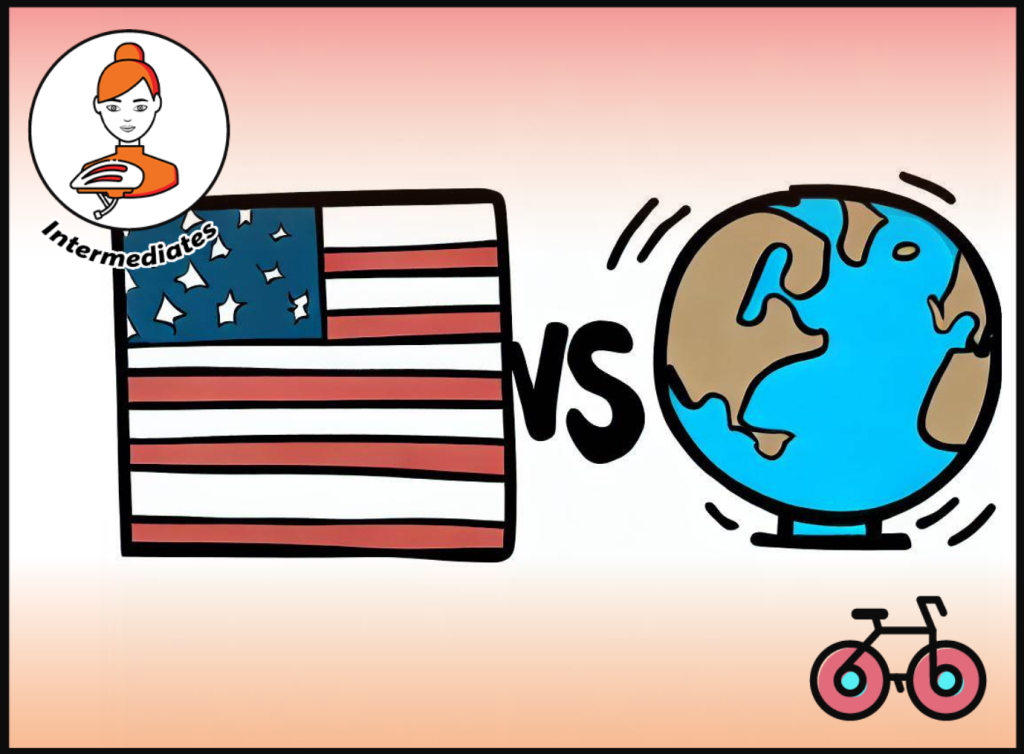

The Definitive Guide to Equity Index Investing - PART 5
This article is Part 5 of our definitive guide to Equity Index Investing.
As portfolio managers, we are constantly reminded of changes in the world’s economy. Yet, our minds tend to resist change. Especially, when we have an emotional attachment to a country.
Over the past 20 years, I visited most of the U.S. States. I spent time at NYU and joined a prestigious Wall Street Graduate Programme in the late 2000s. I was impressed by Silicon Valley. But while cycling the world, I was confronted with realities that I previously underestimated. This century may not belong to America.
Here are risks and opportunity costs to consider by concentrating your investments. Even in the strongest country, like the U.S.
KEY TAKEAWAYS
- Over the past 50 years, the US Market outperformed the Rest of the World by 1% annually. But all of it came in the last 8 years.
- Compared to the S&P 500, a Global Portfolio has lower volatility and increases the likelihood of financing your projects, especially in the medium-term.
- Your expected returns depend on the starting point. US Markets are, by historical standards, expensive.
- In the past century, investors in certain markets were wiped out due to geopolitical upheavals, debt crises, or bursting of bubbles while other countries remained resilient.
- Global Markets’ high correlations don’t justify relying only on the US, because correlations don’t capture magnitude of returns.
- U.S. companies often don’t have access to Asian Markets, led by Korean, Taiwanese or Chinese Tech Companies.
- As a European, follow Buffett’s and Bogle’s Investing Principles rather than their advice to fellow US citizens.
Here is the full analysis
#1 BENEFIT FROM THE NEXT LEAP
Did the US Markets always outperform?
Let’s start with one of the biggest misconceptions today – the U.S. Outperformance. Over the past 50 years, the U.S. Market has outperformed the rest of the world by a whooping margin of 1% per year.
The S&P 500 returned on average 9.8% vs. 8.7% for International Markets (ex-US). Even more impressive is the fact that the Index outperformed on a risk-adjusted basis, with a lower volatility of 15.2% vs 17%, leading to higher Sharpe Ratios.
A win-win? Well, not quite. Guess, how much of the 50-year outperformance came in the last 8 years? All of it. History doesn’t crawl. It leaps.
Until 2014, the average annual performance was nearly 9.6%, for both Markets. If history is a guide, it is a matter of when, not if, International Stock will catch up again.
❤️🐶 Shop & Support - Celebrate our 4th anniversary! 4️⃣🎂
Spread the Golden Retriever Wisdom Across Europe & the UK 😎
Banker On Wheels is 4 years old! To celebrate our anniversary we have launched the official merchandise store – Shop.Bankeronwheels.com. You can now get your favourite Golden Retriever, or your factor tilt on a coffee mug or a T-Shirt while supporting our cause! All profits are reinvested into creating more educational content. Alternatively, you can also buy us a coffee. Thank you for all your support ❤️

#2 DILUTE HYPE
By investing globally, nearly a third is allocated to the ‘old Economy’. Yes, by many growth measures, Europe and Japan lag behind. Their heavyweights mainly include Financial or Industrial companies.
Value investing is not very glamorous. But the entry point is cheap. Remember that you can either have high prices or high future returns, not both. The price you pay matters.
The CAPE ratio is just one measure of Stock Markets’ relative attractiveness.
America is Expensive
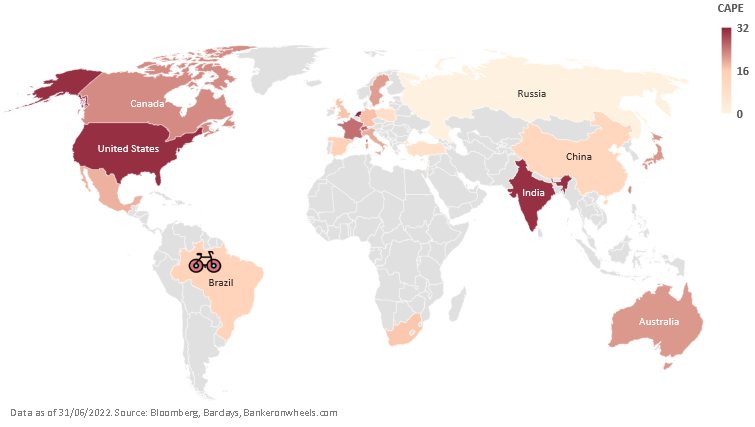
In Dec’21, the CAPE for the US Market stood at 39 (currently 32, as per the map), an expensive level by historical standards. For the UK, it stood at a modest 17.5. Over the next 8 months, the S&P 500 lost over 20% while the FTSE 100 remained roughly flat. Some market participants, including Vanguard, saw it coming.
CAPE has its flaws. For example, valuations can’t be relied upon in the short term. But investing globally often means lowering the purchase price by diluting currently overhyped sectors or countries.
Advertisement

Advertisement

#3 INCREASE THE LIKELIHOOD OF FINANCING YOUR GOALS
Volatility For Select Markets (1970-2020)
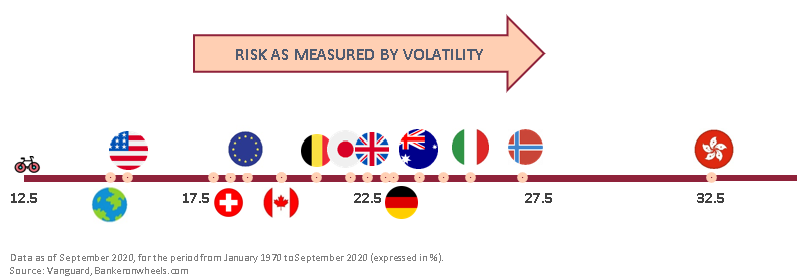
By avoiding hype, you may sleep tight. But there is also another, very practical reason, why you may be more confident of reaching your objectives by investing globally.
Diversifying globally reduces the uncertainty of financing your investment goals, especially if they are medium-term.
It is true that no other country fared better than the US. If you limited your portfolio to certain European or Asian Markets, volatilities were from 15% (Switzerland) to 100% (Hong Kong) higher, according to Vanguard.
The S&P 500 also had a lower volatility than all ex-US countries combined. But combining all of them, including the US, makes your portfolio even more stable.
#4 Hedge against the risk of being wiped out
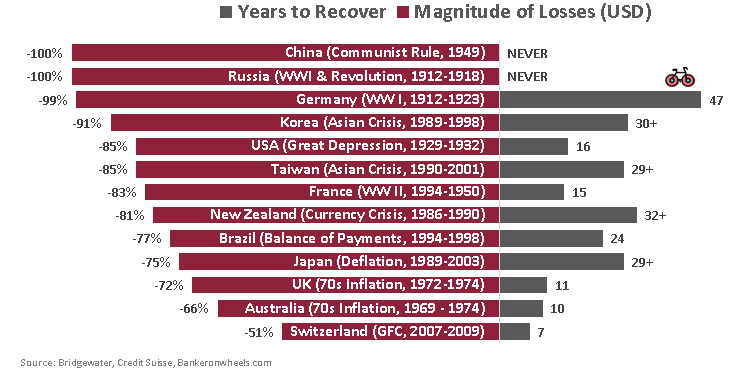
Global investing also reduces an even more important risk. The risk of permanently losing your capital.
In the past century, there have been many times when investors saw their wealth wiped out by geopolitical upheavals, debt crises, monetary reforms, or the bursting of bubbles, while markets in other countries remained resilient.
Individual Markets' catastrophic losses
U.S. Corporations are incredible growth engines, powered by technological edge, global exposure, pragmatical thinking and strong governance. The rule of law, solid institutions and the US Dollar make America a unique place to invest. That’s why U.S. Stocks increased their relative share from 25% of the Global Stock Market in 1990 to 60% in 2020.
Performance as share of Global Stock Market
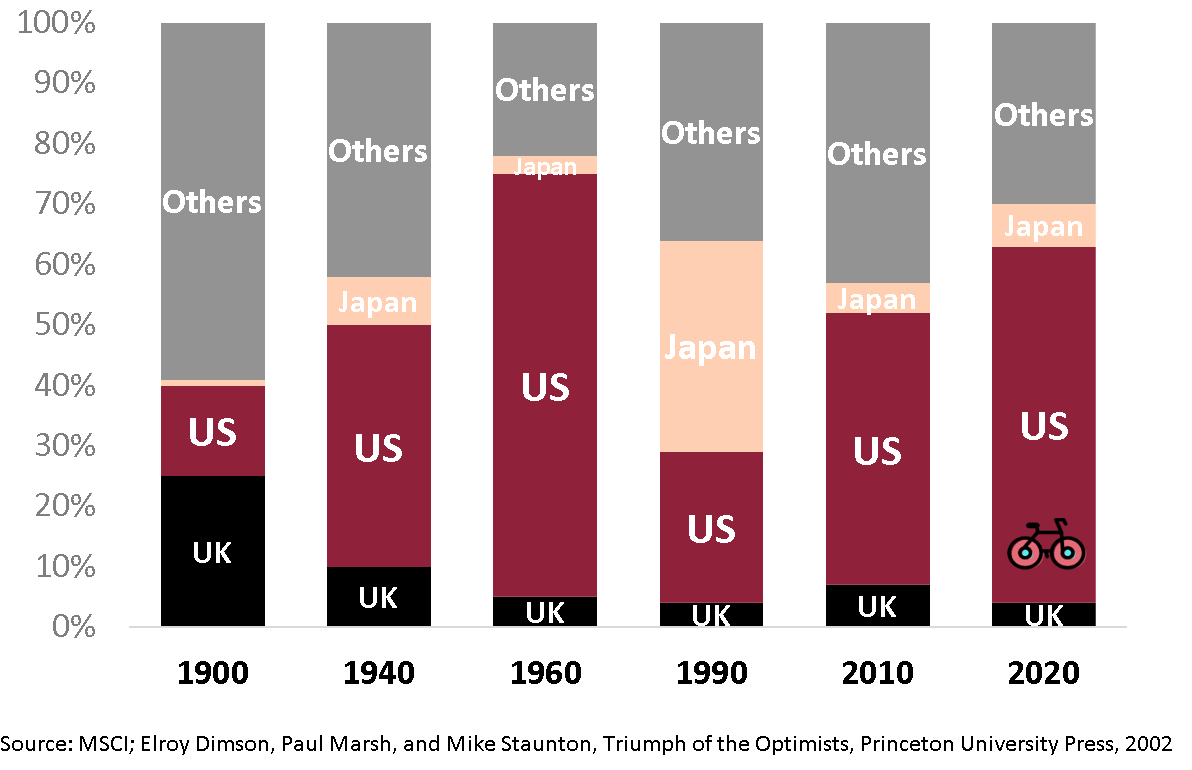
Yet today’s America is like a comet. Its nucleus is more powerful than ever. But the dust tail has a hard time following and becomes more visible.
After having cycled Asia and crossed the Pacific, I came to realize that the main challenges the U.S. faces are not external, but internal. Here are just a few that strike cyclists on the West Coast:
- Parts of America are left behind like the comet’s dust. An impossible catch-up game as inequalities are growing.
- Internal conflicts are rising. Whether measured by protests or political drifts.
- Healthcare is inefficient. Lack of social safety net makes scandals that kill hundreds of thousands of people and leave millions addicted, possible.
Advertisement

As of 29/03/2024, Interactive Brokers offers rates up to 4.738% (GBP), 3.445% (EUR) and 4.83% (USD) on cash.
Advertisement

As of 29/03/2024, Interactive Brokers offers rates up to 4.738% (GBP), 3.445% (EUR) and 4.83% (USD) on cash.
#5 LOOK BEYOND HIGH CORRELATIONS
In today’s globalised world, it doesn’t matter where a stock trades, but where it makes money. Take the pharmaceutical firm GlaxoSmithKline. It is part of the UK’s FTSE 100 Index and yet, it generates almost no revenue in the UK.
This is not an exception. US firms generate 38% of their revenues outside the US. In the UK, the proportion is 78%. In France or German it’s above 80%.
So, aren’t all these firms exposed to the same risks? If a global market sell-off were to occur, wouldn’t the same shocks impact both S&P 500 and FTSE 100 companies, given their exposure to global demand? That’s what S&P 500 proponents argue. Keep it simple, avoid international exposure because if there is a crash, there is nowhere to hide.
Today All Stocks are exposed to Global Shocks
| INDEX | % Sales Inside Home Country | % Sales Outside Home Country |
|---|---|---|
| S&P 500 | 62% | 38% |
| FTSE 100 | 22% | 78% |
| CAC 40 | 18% | 83% |
| DAX | 19% | 81% |
| ASX 200 | 58% | 42% |
Indeed, given globalisation, correlations between all markets only kept rising.
But this argument misses a key point. Diversification is more than correlation.
It is also about the magnitude of price moves. Take two stocks – Tesla and Walmart.
- Let’s consider some data. Suppose Tesla’s stock rises 5% and Walmart’s increases by 2%. Alternatively, if Tesla’s stock drops by 1.5%, Walmart’s decreases by 0.5%. The correlation is high. And yet, the returns are not the same.
- In the real world, European or Japanese small-cap value stocks, may not react to the same degree to shocks, depending on the nature of the crisis, as US Tech, even though the correlation is very high.
#6 Don't Forget About EmerGing Asia
There are at least two reasons why with Emerging Markets, you may want to have skin in the game.
First, while the downside is limited, your upside may be asymmetric.
Today, Chinese Stocks have almost no impact on the performance of a Global Equity ETF. In fact, their entire allocation weighs less than that of Microsoft. Combined, Emerging Markets Stocks only represent c. 10% of a Global ETF.
That’s because of various screens applied by Index providers, due to these market segments being difficult to access. Without them, EMs should stand at 26%. Yet, today, six out of ten people live in EMs. They account for over 50% of global GDP. By 2025 they may capture 70% of global growth. Partly through Tech.
While cycling in Asia, I noticed that US Tech companies have little to no access to certain markets. And some super apps like Tencent’s Wechat or Line are much more powerful than Western apps.
Emerging Markets Are Tech Heavy
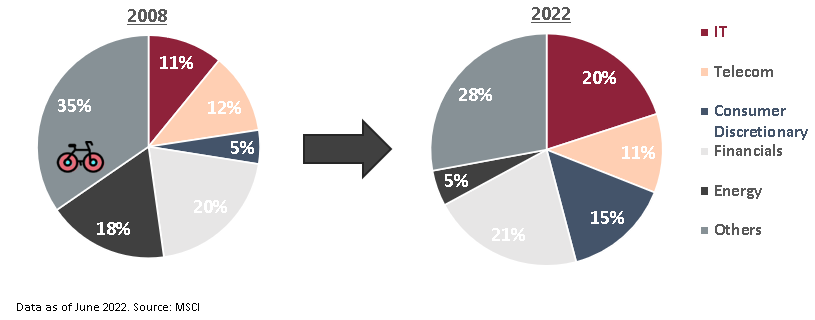
Most investors know that Tech dominates the S&P 500. What’s less known, is that Asian Tech is rising to the same extent:
- IT and Communication firms including Samsung, Taiwan Semiconductors, Tencent or Indian Infosys account for over 30% of EM’s Market Cap.
- By adding E-commerce platforms, like Alibaba or JD.com, that make up most of Consumer Discretionary sector, investors capture 46% of EM Equities.
#7 DARE TO 'DISAGREE' WITH BUFFETT AND BOGLE
Upon his passing, Warren Buffett directed the trustee for his wife’s benefit to “put 10% of the cash in short-term government bonds and 90% in a very low-cost S&P 500 index fund.” Jack Bogle even went a step further and favoured a fund tracking a larger US Equity Index – the Total Stock Market Fund.
Don't look for the needle in the haystack. Buy The Haystack.
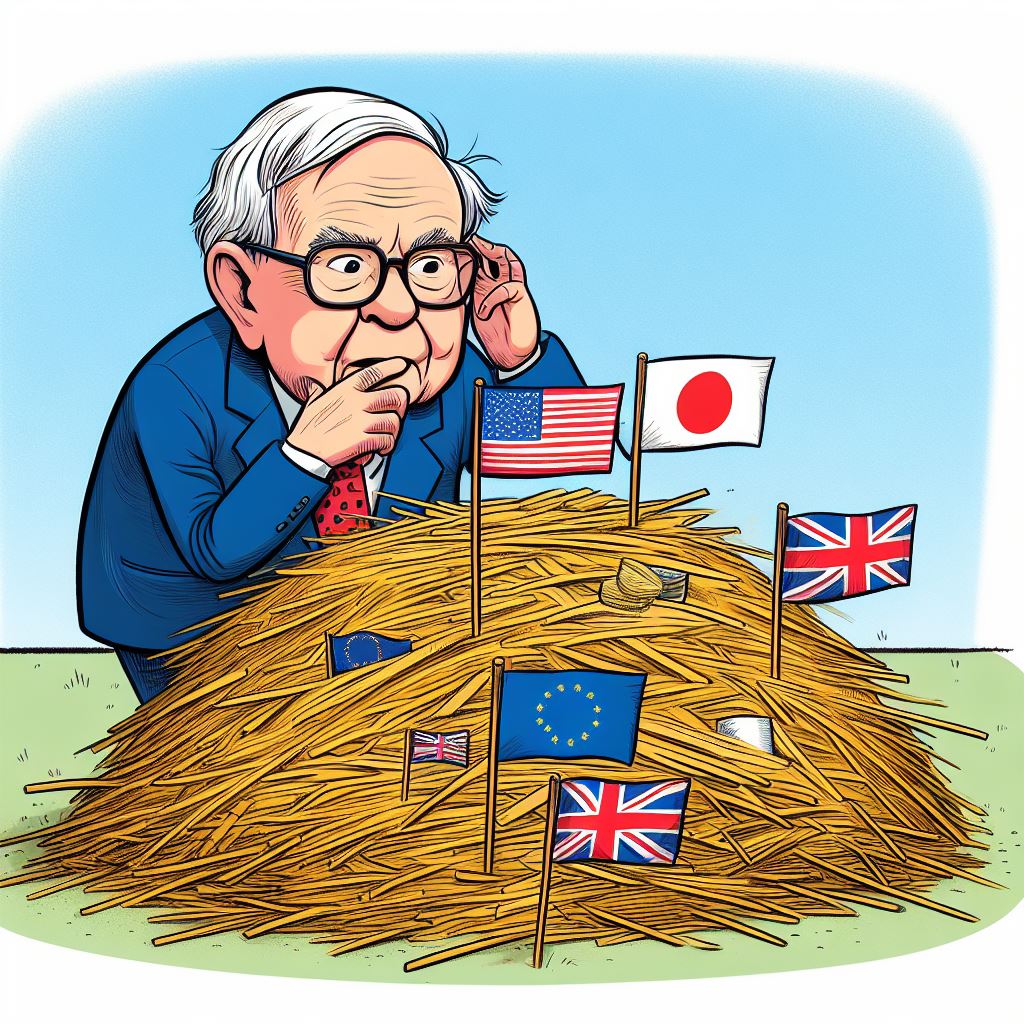
If you follow Buffett and Bogle’s advice, chances are you will end up wealthy. Why? Because the behavioural aspects, low fees, and broad-enough diversification, that both preach will determine most of your success.
They are more important than the S&P 500 vs. Global ETF debate.
But since you are reading this website, chances are you have an above-average investing acumen. You can use academic research that expands on Buffett & Bogle’s diversification principles and take it a step further.
Don’t try to pick the winning country. Buy them all.
From Bankeronwheels.com
Get Wise The Most Relevant Independent Weekly Insights For Individual Investors In Europe & the UK
Liked the quality of our guides? There is more. Every week we release new guides, tools and compile the best insights from all corners of the web related to investing, early retirement & lifestyle along with exclusive articles, and way more. Probably the best newsletter for Individual Investors in Europe and the UK. Try it. Feel free to unsubscribe at any time.
🎁 In the first email, you can download a FREE comprehensive 2-page checklist to construct & monitor your portfolio and clean up your personal finances.
NEXT STEPS
You may nevertheless decide to increase the allocation to the U.S. Market because you think current trends will continue for a while. But how to implement such tilt tax-efficiently? Let’s have a look at this in the next part of this guide, covering the cheapest S&P 500 trackers with synthetic replication strategy.
Good Luck and Keep’em* Rolling!
(* Wheels & Dividends)


The Truth About €1 Million Broker Guarantees


Dodl By AJ Bell Review – AJ Bell’s Younger Brother


Vanguard LifeStrategy Review – A Retriever In A Babushka Doll


Why Do Portfolio Managers Care About Factors? It’s Not What You Think.


Money Market Funds: Are ETFs The Best Bang For Your Buck Or A Risky Ride?


4 Things I Learned In 4 Years Of Running A Finance Blog
HELP US
🙋 Wondering why finding honest Investing Guidance is so difficult? That’s because running an independent website like ours is very hard work. If You Found Value In Our Content And Wish To Support Our Mission To Help Others, Consider:
- 📞 setting up a coaching session
- ☕ Treating us to a coffee
- 🐶 Purchasing Our Official Merchandise
- ❤️ Exploring Other ways to support our growth, both financially and non-financially.
DISCLAIMER
All information found here, including any ideas, opinions, views, predictions expressed or implied herein, are for informational, entertainment or educational purposes only and do not constitute financial advice. Consider the appropriateness of the information having regard to your objectives, financial situation and needs, and seek professional advice where appropriate. Read our full terms and conditions.