
The objective of this calculator is to provide an intuitive tool that illustrates the impact or rising rates and risk of holding Bond ETFs vs. Cash.
The calculator provides a high level view on magnitude of Government Bond ETFs Total Return with (i) negative impact from rising interest rates (e.g. triggered by inflation) followed by (ii) positive impact from central bank intervention in a recession scenario.
Finally, the calculator aims to give intuition around some financial concepts that are often misunderstood.
- How can I compare holding Bond ETFs vs. Cash? Run the calculator and look at the Bond ETF price. Compare that to 100 which is the amount you would have if you kept cash instead of investing in a Bond ETF.
- Is locking-in a ‘guaranteed’ return for an investment horizon possible with Bond ETFs? Using simplified assumptions as described below, it is possible with Constant Maturity Bond ETFs. Price falls due to rising interest rates are temporary. And over time, they will be offset by higher coupons.
- In the worst case, how long is this investment horizon? Because Constant Maturity Bond ETFs keep a constant maturity range, in order for the initial yield to be ‘locked-in’, the required holding period is significantly longer than traditional Bonds. If we proxy it by keeping a constant duration, and using certain simplified assumptions, this holding period can be up to two times ETF duration if rates continue going up (but can be shorter period and depends on when you assume rate hikes will stop).
- When is it beneficial for Bond ETF holders to see rates rising? Rising Yields are nominally beneficial if your investment horizon is longer than two times duration (in years). At that point, the higher coupons will offset any negative price impact from rising rates.
- Is there any other risk with holding Bond ETFs with rising rates? Yes, it is still problematic in real terms, because rising rates are usually driven by high inflation. The Bond ETF price (which includes distributed and reinvested coupons) and Cash – will be equally affected by Inflation.
- What is the advantage of holding Bond ETFs vs. Cash? Bond ETFs provide protection in a deflationary/recession scenario – this is represented in the simulator by an illustrative ‘pop’ effect on Bond ETF prices when Central Banks cut rates. In reality, this effect may be less or more pronounced, depending on beginning of recession interest rate levels. This can be beneficial when Equities are in a Bear Market and the investors use rebalancing, by selling Bond ETFs and rotating into cheaper Equities.
- Are higher duration Bond ETFs more risky? On their own, they tend to decrease in price more with rising rates. But within a portfolio, higher duration Bond ETFs bring more potential rebalancing benefit. E.g. if the IEF ETF has a duration of 8, then for a 1% change in interest rates, the ETF price with change by approximately 8%.
INPUTS
- Average Yield to Maturity – Current ETF yield which can be found on ETF provider website (e.g. IEF or VCIT)
- Current ETF Price – Current ETF price which can be found through your broker or investor websites
- ETF Duration – Current Effective Duration which can be found on ETF provider website (e.g. IEF or VCIT)
- Expected Annual Interest Rate Hike – Annual shock (in %) to Yield as proxy of rise in interest rates
- Last Year of Interest Rate Hike (optional) – Year when calculator will stop increasing yields and keeps them flat
- Start of Next Recession (optional) – Year when calculator will lower market Yield to an illustrative level of 1%, simulating Central Bank action to a severe shock
- Annualized Total Return – The most important output since it captures the CAGR before Inflation. For Constant Maturity Bond ETFs, return includes (i) compounding effect of reinvested dividends and (ii) price change impact from rising/falling rates. As such this calculation takes a Total Return approach. Some positive price impact may be underestimated e.g. for large interest shocks or/and high duration funds, as explained in the convexity section below.
- ETF Price – Calculated based on the assumption of reinvested dividends. Calculated at each end of period. Some positive price impact may be underestimated e.g. for large interest shocks or/and high duration funds, as explained in the convexity section below. Compare this price to 100 to see the benefit/downside of holding Bond ETFs in your scenario.
- Yield – or level or current Interest Rates. Represented by ETF Average Yield to Maturity (YTM). Forward looking yield to maturity at the start of each period. It is the expected return to be achieved on all cash flows excluding reinvested coupons (which are invested at the prevailing rate on each period). Read more about YTM and reinvested coupons.
- What are Constant Maturity Government Bond ETF? Most ETF Bond Funds are typically managed to keep average maturity within a constant range. This objective is proxied by keeping duration constant. In this simulator, ETF re-balances at each period into newly issued Government Bonds issued at par. Most recent bonds issued by governments tend to have coupons very close to the current yield. The calculation assumes the asset manager is reinvesting coupons/dividends (conceptually like a Accumulating ETFs, e.g. in Europe). The purpose is to capture in the price a total return.
- Can I simulate currency Hedged Bond ETFs with the Calcualtor? If relevant, to assess the likely impact Initial Yield should be taken from current local Government Bond Yields in Investor’s Domicile/Currency Area and broadly matching the ETF’s duration. Assumes interest rate parity. Hedged returns are expected to broadly replicate the performance of local Bonds (Vanguard, April 2018 paper) albeit with additional diversification benefit.
- Can I simulate Aggregate Bond ETFs with the Calculator? The projection may be a slightly distorted proxy for Aggregate Bond ETFs. But since Aggregate Funds are predominately invested in Government Bonds the overall impact should be captured. Other risks include Credit risk (OAS) which plays a role, and is is not modelled here. Convexity impact is usually marginal, usually positive as MBS/Callable Bonds’ effect may be offset by larger impact of positive convexity Government Bonds in typical Aggregate Bond Fund. Thus, the simulator may also be (marginally) conservative from convexity standpoint (e.g. as of March 2021, iShares AGG ETF convexity is 0.1).
- How is recession and crisis impact modelled ? Central Bank rate cut is simplistic in this simulation and assumes a drop to 1% within 3 months following a severe crisis (exogenous shocks e.g. COVID-19). It overrides any previous user rate hike assumptions and stops projection after calculating initial price impact. The 1% level is an illustration and the lower it goes, the higher the price increase.
- What is represented by duration? It is a proxy for ETF Effective Duration and/or OAD, should any Bonds have embedded options (assumed marginal, since most of optionality is credit related and this simulator is focusing on broadly mimicking Government Bond ETFs). Duration assumed to be adjusted to ETF initial objective at end of each period. Assumes a parallel shock to the interest rate curve. Duration effect may be underestimating some positive price impact, e.g. for large interest shocks, very low/negative yields or/and high duration funds, as explained in the convexity section below.
- Are Roll returns included? No, they are excluded for simplicity of analysis and assumed to be of marginal impact
This calculator takes a Total Return approach, reflecting reinvested coupons and price impact on ETF due to rising/falling rates.
The calculator simulates Constant Maturity Bond ETFs. These funds represent the majority of ETFs available to retail investors (e.g. Vanguard’s VCIT or iShares’ IEF for medium term investment horizon).
What are the calculator’s limitations?
The calculator assumes a parallel shift in the yield curve. Convexity is also excluded from rate hike/cut impact. This calculator’s objective is to give a high level price impact guidance and return magnitude in a rising yield environment. It does not provide full benefit of holding the ETF, due to its sole reliance on duration. As such, the simulation is conservative from Investor’s perspective, as most government bonds are usually characterized by positive convexity.
The actual price/return impact for the Investor is likely to be more beneficial in all scenarios than the above projection.
Which Bond ETFs are best proxied by the calculator?
The simulator proxies most accurately ETFs for a medium term investment horizon e.g. with duration of 8-10 years. Most Investors with a medium to longer time horizon choose such Government or Aggregate Bond ETFs.
When will Bond ETFs yield better results than the calculator’s simulation?
Scenarios where convexity impact may be material include, but are not limited to (i) near zero/negative nominal interest rate environment (ii) large interest rate shocks occurring in a short timeframe and (iii) high duration Bond ETFs (e.g. duration above 15 years)
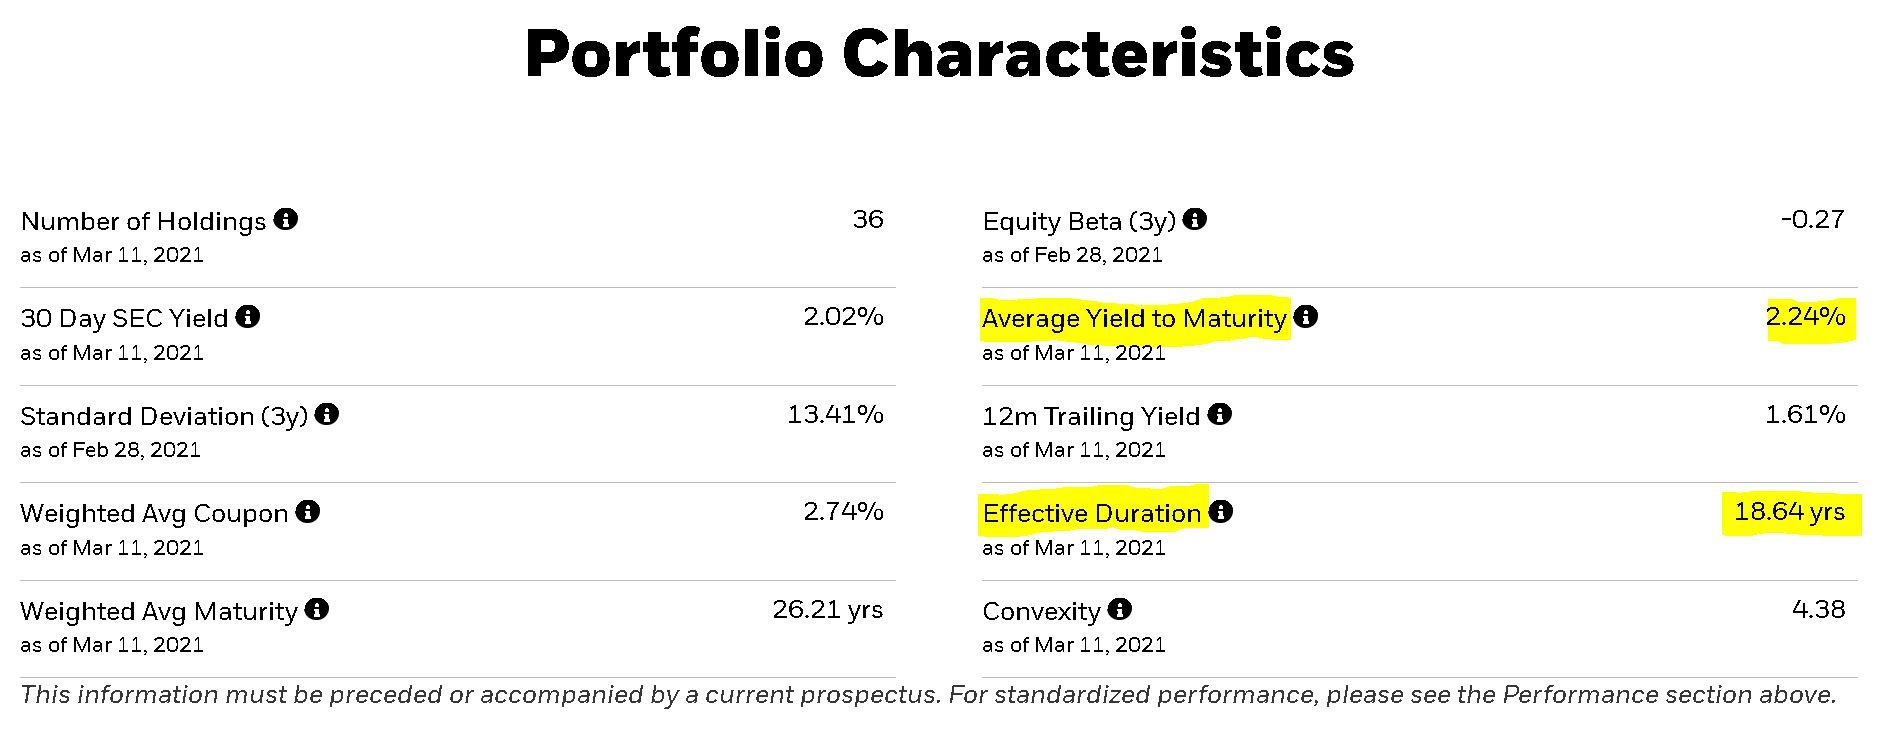
To illustrate a combination of factors (ii) and (iii), let’s look at iShares TLT ETF. As of March 2021, the fund has a yield of ~2.2%, duration of 18.5 yrs and a convexity of 4.4:
- As such, for an instantaneous 1% increase/decrease in interest rates, the ETF price will change by +/- 18.5% (assuming only duration). By contrast, the change would be +20.7% if interest rates fell by 1% and -16.3% if rates increased by 1% (assuming both duration and convexity). The impact may be judged to be fairly marginal.
- However, for an instantaneous 2% increase/decrease in interest rates, the ETF price will change by +/- 37% (assuming only duration). By contrast, the change would be +46% if interest rates fell by 2% and -28% if rates increased by 2% (assuming both duration and convexity). A more pronounced effect.
In each case, convexity benefits the investor. As illustrated, the effect is particularly pronounced for simultaneous combination of the factors above. Convexity benefit accelerates with yields below 2% but the benefit from convexity also significantly drops once yields increase.
Finally, remember that for constant maturity Bond ETFs, Bond Maturities (and duration) are actively managed, which may affect the actual benefit of convexity.
An introduction to this calculator and commenting section is also available (commenting is switched off here below)