Bankeronwheels.com Broker Review Methodology
When choosing a broker, investors face a myriad of considerations, from safety measures to fee structures and beyond. Bankeronwheels.com takes a unique approach to broker comparison, designed with the discerning investor in mind. Here’s how we guide you through making an informed decision:
- We Focus On Wise Investors – We assess brokers based on typical requirements of our readers, that prioritise long-term compounding, safety and low fees. We penalise brokers that have riskier business models, not enough capital or/and focus on niches such as overpriced speculative instruments. 👉 Read how we define wise investors.
- We Categorise Brokers Into 5 Groups – Investors may have different priorities given the size of their portfolios and overall goals. For beginners, a low-cost Tier 2 broker may be appealing, while an investor with significant assets may prioritise safety and a broker within a banking group or Tier 1 category. 👉 Read who we categorise brokers.
- We Provide Safety Considerations – We offer safety considerations to help users make informed decisions. But, we have no safety sub-score. The omission of safety scores is deliberate, as assessing the safety of a broker involves a complex array of factors – often requiring access to private information – including financials and operational data. Instead, our goal is to highlight some safety and transparency considerations that typically go into Probability of Default / Loss Given Default estimations. 👉 Read how we approach safety.
KEY TAKEAWAYS
Each broker is given two scores – An absolute score called Broker Score and a relative score called Category Ranking:
- Company Score – evaluates brokers based on objective inputs into typical likelihood of survival assessment, transparency, and business risks, focusing on factors like banking affiliation, transparency measures, risk mitigators, and the nature of their product and service offerings, without providing specific safety scores.
- Fee Score – We assess the impact of recurrent fees, such as custody and inactivity fees, on long-term compounding, differentiating between one-off and ongoing charges.
- Platform Score – Key considerations for all investors include easy share transfers, availability of UCITS ETFs or automated investing, alongside specialised needs such as U.S. ETF, mutual fund and bond access or derivatives markets.
- Tax Handling Score – The assessment includes the importance of standard tax reporting for compliance and ease of tax filings for all investors, as well as customised reports or tax wrappers for adapting to country-specific tax laws
Here is the full analysis
SCoring Process
How do we establish scores?
Each Broker goes through a rigorous process
Our Scoring Process
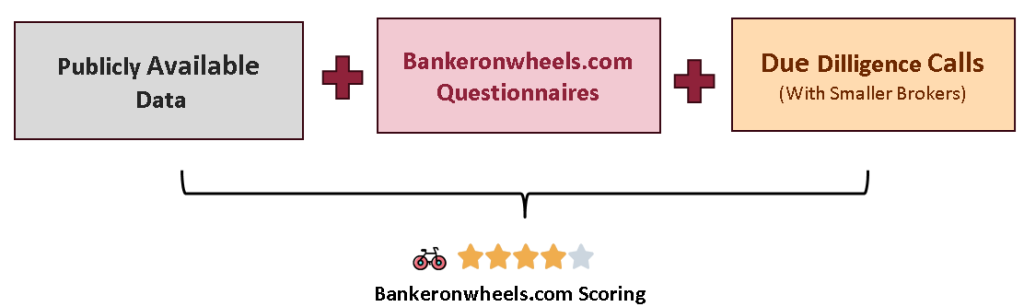
- We Collect Data: Initially, we aggregate all publicly accessible data, sourced directly from brokers as well as a diverse array of third-party entities. To meticulously monitor the evolution of broker documentation and various other inputs over time, we maintain comprehensive archives of data snapshots.
- We Send Questionnaires – In instances where public data proves insufficient, we proactively seek additional information by distributing detailed questionnaires to relevant entities.
- We Conduct Calls – Extending from operational staff to the upper echelons of broker management. These interactions are key in bridging informational gaps, ensuring a holistic understanding of each broker’s operations. If questionnaires and/or calls are not sufficient to address our key concerns, we will assume the worst case as scoring input.
- We Benchmark And Score Brokers – Leveraging our proprietary evaluation framework, we assign scores to brokers, which are then benchmark against peers. This process is overlaid by our expert analysis, ensuring that our assessments are both comprehensive and insightful.
Broker Score weights
How is it determined?
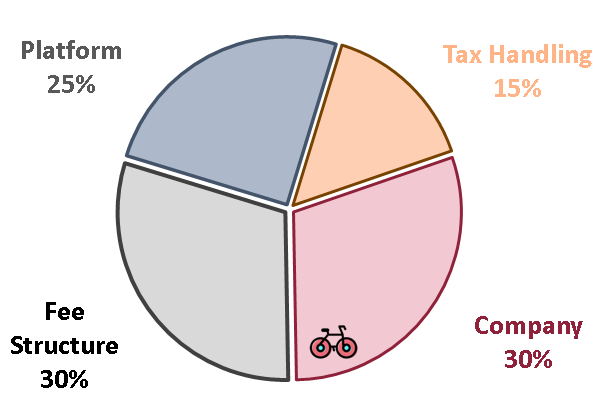
Weight Of Areas In The Methodology
This graph shows you the importance of each subscore to our absolute Broker score. For example, 30% of the total score depends on Company (including Safety Considerations or Transparency). We may overlay it with a qualitative input based on our expert assessment. But, we also provide the subscores, so you can assess based on your own preferrences for certain areas.
Importance of areas
Company
what are the key considerations?
Likelihood of survival, Transparency And Business Risks
We will not assess the broker’s probability of default or provide safety scores. However, we may rely on external metrics like ratings – if available – to estimate the implied risks, based on historical default for similar cohorts. We will also provide safety considerations, that may to some extent play a role in assessing the risks, including but not limited to:
- Banking Affiliation: Affiliation with a systemic banking group provides benefits such as implied investment grade ratings, greater oversight, revenue diversification, and potentially increased protection.
- Transparency: Credit Ratings, Exchange Listing or Public Accounts increase transparency.
- Risk Mitigators: Higher Risk-Adjusted Capital, tighter regulations for banking entities, or profitability potentially decrease risks.
- Product and Service Offerings: Offering leveraged products may introduce additional business risks, PFOF reliance may imply business model risks, while additional guarantees could provide increased protection.
Company score - Key criteria
| Aspect | Impact on Score | Illustrative Considerations |
|---|---|---|
| Years In Business | Very High | Proven Resilience |
| Systemic Banking Group | Very High | Affiliation Often Implies IG Rating |
| Any Banking Group | High | Affiliation Offers Revenue Diversification |
| Bank Licence(s) | High | Capital Requirements |
| Debt Rating | High | Increased Transparency |
| Exchange Listing | High | Increased Transparency |
| Detailed Public Accounts | High | Increased Transparency |
| Profitability | High | Increased Likelihood of Survival |
| Market Capitalisation | High | Increased Transparency / Potentially Capital |
| Tier 1 Capital | High | Potential Increased Protection |
| Experience of Regulators | High | Oversight and Compliance |
| Reputation | High | Impact on Business |
| History of Fines | High | May Imply Operational Risks |
| Reliance on PFOF | High | May Impact Business Model |
| Additional Guarantees | Medium | Potential Increased Protection |
| Leveraged Products | Medium | May Increase Business Risks |
Fee Structure
what are the key considerations?
Recurrent fees that eat into compounding
The table highlights how different types of fees, such as custody fees and inactivity fees, can have a very high impact on long-term investment strategies like buy-and-hold:
- Variability and Occurrence of Fees: We distinguish between one-off and recurrent fees, indicating that commissions, foreign exchange (FX) fees, and other fees can either be a one-time charge or recur over time, affecting the overall cost of investment transactions.
- Penalising Fees: Particularly Custody or Inactivity fees are critically assessed.
- Medium Impact Fees: Withdrawal, deposit, and share transfer fees are categorised as having a medium impact, given their one-off nature.
Fee Structure - KEY criteria
| Aspect | Impact on Score | Illustrative Considerations |
|---|---|---|
| Custody Fees | Very High | Equivalent to higher TERs |
| Inactivity Fees | Very High | Penalising for Buy&Hold |
| Commissions | High | One-off / recurrent fees |
| FX Fees | High | One-off / recurrent fees |
| Other Fees | High | If penalising for Buy&Hold |
| Withdrawal Fees | Medium | One-off fees |
| Deposit Fees | Medium | One-off fees |
| Share Transfer Fees | Medium | One-off fees |
Platform features
what are the Common considerations?
criteria For all investors
- Common Features: Easy share transfers, UCITS ETF availability, and lit exchange access are critical for changing brokers without tax consequences, diversifying portfolios, and ensuring the best execution of trades for all investors.
- Automation And Income: We place high importance on user-friendly platforms and recurrent investing features, but also revenues from interest/securities lending.
- Specialised Needs: Some features like mutual fund access, bond markets, or derivatives cater to specific investor requirements (read the section below the table)
platform score -Key criteria
| Aspect | Impact on Score | Illustrative Considerations |
|---|---|---|
| Share Transfer | Very High | Broker Change w/o tax |
| UCITS ETFs | Very High | Availability |
| Lit Exchanges | Very High | Best Execution |
| Ease of use | High | Accessibility |
| Recurrent Investing | High | Key For Automated Investing |
| Family Subaccounts | High | Nice To Have |
| Cash Interest | High | Reduced Opportunity Costs |
| Security Lending Revenues | High | And Opt-in/Opt-Out functionality |
| Multicurrency | High | Reduces FX frictions |
| Mutual Funds | Investor Specific | Important to Select Investors |
| Bonds | Investor Specific | Important to Select Investors |
| Elective Professional Status | Investor Specific | Important to Select Investors |
| US ETFs | Investor Specific | Important to Select Investors |
| Margin Loans | Investor Specific | Important to Select Investors |
| Derivatives | Investor Specific | Important to Select Investors |
What are the investor-specific considerations?
Investor-Specific Suitability
We assess broker suitability based on the three typical investor profiles. For example, Bond Market or Mutual Fund Access could be important for Cyclists that want a more customised portfolio. For Bankers, US ETF access, Margin loans and derivatives could be beneficial to construct risk parity portfolios or access factor ETFs not available in the UCITS format.
Illustrative Suitability

Suitable
e.g. simple & automated investing considerations

Suitable
E.G. Some Market access considerations

SOMEWHAT Suitable
E.g. Margin loans or US ETF Access considerations.
⚠️Suitability not only depends on the portfolio complexity, but also on the investment amount. Given the low Investor Compensation Scheme thresholds in Europe, we emphasize Broker Diversification.
TAX Handling
what are the key considerations?
- Essential Tax Management: Standard tax reporting is crucial, serving as a key feature for all investors to ensure compliance and simplify tax filings.
- Personalised Solutions: Customized tax reporting and tax wrappers are highly valued for their adaptability to country-specific tax regulations, offering tailored tax management solutions.
Tax score - Key criteria
| Aspects | Impact | Illustrative Considerations |
|---|---|---|
| Standard Tax Reporting | Very High | Key Feature |
| Customised Tax Reporting | High | Country-specific features |
| Tax Wrappers | High | Country-specific features |
FAQ
They are two different metrics:
- The Broker Score is an absolute score. With this score you can compare any broker across all categories. The criteria and weights are the same whether the broker is backed by a Bank, an independent Tier 1 or Tier 2 broker.
- The Category Rank is a relative score. The idea is to compare ‘comparable’ brokers. For example, Interactive Brokers plays in a different league than Lightyear. Read here how we think about broker categories.
We have two assessments (but we only call one a ‘Score’), because investors needs are often very different. The inputs for both the Broker Score and the Category Ranking are the same, but the weights change. For example, investors choosing Tier 2 Brokers typically invests smaller amounts and prioritise fees and platform/tax handling over company track record as they are fully covered by National Investment Protection Schemes.
Investors with large portfolios typically exceed the Investment Protection Schemes and put a lot of emphasis on the long-term viability of the broker’s business and its track record. That’s why our absolute Broker Score includes a 30% weight to the ‘Company’.
New investors with smaller portfolios often choose fully-digital brokers and prioritise costs and platform functionality over company track record, as most of these brokers are start ups. Cost reduction in an early phase is especially important due to compounding. In that case investors may look at relative category rankings. Investors may ultimately consider a transfer to a Tier 1 Broker once the accounts grows larger, for example to reduce counterparty risk if the broker remains unprofitable over the years. In our relative rankings, we heavily penalise brokers that don’t allow share transfers.
We are currently calibrating the weights for category rankings. We will provide more transparency as we get more data and expand our coverage universe.
With respect to Tier 2 Brokers, the weights are as follows:
- Company – 10%
- Fee Structure – 45%
- Platform – 30%
- Tax Handling – 15%
No one can. We Provide Safety Considerations to help users make informed decisions. Assessing the safety of a broker involves a complex array of factors – often requiring access to private information – including financials and operational data. But in our reviews we research relevant inputs that may play a role in the safety, so you can reduce risks based on those considerations. We also include information that is relevant based on our due diligence calls with brokers.
There are five categories:
- Direct Brokers (backed by Banks)
- Traditional Brokerage Arms of Banks
- Tier 1 Brokers (non-Bank)
- Tier 2 Brokers (non-Bank)
- Tier 3 Brokers (non-Bank)
We have a guide explaining how we think about them.
We deliberately decrease the importance of certain aspects that are less relevant to the success of investors, such as availability of stock research or/and videos / educational materials. This is because (i) Brokers should focus on their job and do it well and (ii) Brokers very often don’t educate well given their incentives for you to trade often and obvious conflicts of interest. Promotion of certain markets that harm investors (e.g. CFDs) is also not an advantage.
We have a whole section dedicated to broker selection, including fee structures found in Europe and the UK, safety, taxes and platform features.