Should You Invest 100% In Equities?

LATEST RESEARCH SUGGESTS HAVING AN ALL-EQUITY PORTFOLIO

We live in extraordinary times. Just a decade ago, the mere idea of launching a website like ours, rooted in evidence-based investing, would seem far-fetched due to a general disinterest. Today, academic insights like the recent paper ‘Beyond the Status Quo: A Critical Assessment of Lifecycle Investment Advice’ by Scott Cederburg, Michael O’Doherty, and Aizhan Anarkulova, which challenges traditional asset allocation are not just noted – they’re often implemented by individual investors. 

At Bankeronwheels.com, our interaction with thousands of investors entrusts us with the responsibility to contextualise the latest findings accurately, including from a European viewpoint. As we dissect new research through our lens of market practitioners, we also urge investors to tread carefully, avoiding rash shifts in strategy spurred by any one study, however novel, that contradicts decades of established evidence.

Today, let’s find out whether you should opt for an All-Equity portfolio. 

This Article has been featured in the Financial Times

KEY TAKEAWAYS

  • What Sets This Study Apart? It takes the perspective of investors from 38 different countries and uses multi-year blocks of data, allowing stocks to rebound.
  • Why’s Everyone Talking About It? Its bold suggestions, like eliminating bonds from a portfolio, even in retirement, or advocating for a 35-50% home-country bias are highly controversial. We disagree with both conclusions.
  • Pre-Retirement Planning – The shift away from bonds isn’t driven by the international perspective, but mostly by the study’s approach to using long data blocks. That’s why an investor should assess whether her timeframe is similar to the study’s— four decades of working life followed by retirement. In those cases, a 100% global portfolio could make sense. However, 100% Equity portfolios are not efficient.
  • Post-Retirement Strategies – You probably shouldn’t invest 100% in Stocks during retirement. The evidence for a home-country bias in this paper is close to statistical noise, with a weak narrative. In reality, the data lends support to a global Equity portfolio. The analysis suffers from misclassification of some Equity, and a significant number of Fixed Income markets. The overall volatility data is skewed by one country.  The study also uses low Equity correlations (0.35) from the past century that don’t reflect today’s levels (over 0.7), and does not include data that may be relevant in the future.
Here is the full analysis

Note: ‘100% Equity Portfolio’ and ‘All-Equity Portfolio’ in this review refer to the 50% Local Equity and 50% International Equity (defined as Global ex-Local) Allocation, unless stated otherwise. The authors of the paper compare it to a 100% Local Equity Portfolio, as well as other traditional portfolios. I also compare it to a 100% Global portfolio.

What Sets This Study Apart?

2,500 years of data & Equity Rebounds

  • Getting a Global Perspective – The paper uses an astute way of increasing returns data. Instead of looking at 130 years of data from a U.S. perspective, the authors look at the same historical events from 38 different countries. With this neat trick, they create over 2,500 years of data.
  • Showing Equity Rebounds – In traditional ‘what-if’ simulations, academics look at monthly historical events. They create millions of alternative worlds, which may have happened, but never did. In some of these alternative worlds, Stocks struggle a lot. An alternative is to run simulations on multi-year blocks, but mix decades and countries. This paper uses blocks of data (10-year on average), that show that stocks often bounce back after sell-offs. It makes Equities look much more attractive. While this technique may raise eyebrows, it is not new, and has its merits.
  • Cleaning Up Historical Data – The academics spent considerable time cleaning up existing datasets, adjusting for survivorship bias – including in countries like Argentina or Czechoslovakia – and easy data bias used by some prior research.

❤️🐶 Shop & Support - Celebrate our 4th anniversary! 4️⃣🎂

Spread the Golden Retriever Wisdom Across Europe & the UK 😎

Banker On Wheels is 4 years old! To celebrate our anniversary we have launched the official merchandise store – Shop.Bankeronwheels.com. You can now get your favourite Golden Retriever, or your factor tilt on a coffee mug or a T-Shirt while supporting our cause!  All profits are reinvested into creating more educational content. Alternatively, you can also buy us a coffee. Thank you for all your support ❤️

Why's Everyone Talking About It?

No Bonds and strong Home-Bias

The two key takeaways are:

  • You Should Abandon Bonds – According to the authors, Bonds don’t help to achieve goals like maximising wealth at retirement. But, they are also unhelpful during retirement – even in some of the worst-case scenarios – as compared to traditional portfolios. 
  • You Should Load Up On Local Stocks – While global equities offer advantages due to country and currency diversification, the paper also advocates for a 35% to 50% allocation in local equities. This suggestion is deemed universal, regardless of the investor’s location, be it Lithuania or the U.S.

Advertisement

Advertisement

How Does It Impact Pre-Retirement Planning?

Can you invest 100% in Equities before retirement?

You may, but You don't get the best bang for your buck

The paper blurs the line between your risk tolerance and the optimal risk-adjusted portfolio. They are two different things – Nobel Prizes were awarded for thatNo matter how aggressive you are, putting 100% in Equities is not efficient – you don’t get the best bang for your buck. For high-risk takers, leveraging a risk parity portfolio could be safer. Modern ETFs offer this, which we’ll explore in the future (as usual, the devil is in the details🧐).

But, if you’re like most of us, and don’t want leverage or add additional sources of risk – for which you may have to wait a decade to outperform – you may still consider a simple 100% Global Equity PortfolioGranted, it’s not capital efficient, but simplicity has its charms—just ask a Golden Retriever. Who can argue with that? 🐶

When should it Be your starting point?

However, if you want to implement an All-Equity portfolio, think about tilts carefully. As we will see, the study’s home bias falls flat, and its global angle doesn’t shake up conventional asset strategies. The real game-changer? The study’s multi-year block modelling. So, some may argue that the All-Equity conclusion of the study boils down to thinking in decades. There is no doubt that for a fully rational 25-year-old person that is able to handle large drawdowns – which are also smoothed-out by regular injections – a Golden Retriever Portfolio should be the starting point

Why is the paper benefical today?

You Have to pick what you're worried about

The paper sparked a useful debate at a time when most countries move from defined-benefit to defined-contribution schemes : You may not be taking enough risk, partly because we wrongly define it. Aspects like probability of ruin are the most important for investors. Monthly portfolio volatility? Maybe less so. Or, as Nick Murray puts it: “You have to pick what you are worried about. Markets are volatile, but retirement is certain”.
 
So today, some Target Date Funds – Vanguard’s included – may not be aggressive enough. Yet if we all go 100% Equities, it won’t magically create trillions in wealth, as the authors argued. 
From Bankeronwheels.com
Get Wise The Most Relevant Independent Weekly Insights For Individual Investors In Europe & the UK

Liked the quality of our guides? There is more. Every week we release new guides, tools and compile the best insights from all corners of the web related to investing, early retirement & lifestyle along with exclusive articles, and way more.  Probably the best newsletter for Individual Investors in Europe and the UK. Try it. Feel free to unsubscribe at any time.

🎁 In the first email, you can download a FREE comprehensive 2-page checklist to construct & monitor your portfolio and clean up your personal finances.

How does it impact Post-Retirement Strategies?

How does the simulation work?

Back To the Future

Here is where things get controversial. As you approach retirement, your time horizon shortens, stakes increase, and there could be no plan B if you mess it up! For that, you need to pay special attention to what the academics do (here is where The Economist got it wrong – there are no rolling period overlaps):

  • Each Decade, You Time-Travel And Speak Another Language ✈️ – Imagine retiring in 2030. One of the 30-year retirement simulations may play out like this:
    • First decade (2030-2040): You’re in 2010-2019 Istanbul, soaking in the culture and economic climate.
    • Next decade (2040-2050): You’re transported to Japan during 1981-1990, witnessing the largest stock market bubble and part of its crash, while (finally!) mastering Kanji.
    • Last decade (2050-2060): You find yourself in Argentina from 1948-1957, experiencing the onset of a military dictatorship and a market wipe-out. 
  • Your Portfolio: 50% ‘Local’ Equity, 50% International Equity – For each decade you get 50% of local returns (Turkish, Japanese then Argentinian Stocks) and 50% of the rest of the world (World ex-Turkey, World ex-Japan, World ex-Argentina).
  • You Compare It To Traditional Portfolios – e.g. Target Date Funds with some international Equity component, a ‘120-age rule’ Equity Portfolio or a static 60/40 Portfolio (see 🤓 Geeky Section below). In all scenarios, you withdraw 4% annually to live off your portfolio.
  • Forget About Being Picky With Bonds – This is a major constraint. For the traditional benchmark portfolios, the simulations assume 10-year local bonds (without adjusting the duration to your investment horizon). There is also no place for Inflation-Adjusted or Corporate Bonds (the data is lacking).
  • You Can’t Change Your Risk Tolerance – That’s another big constraint. In the study, you need to keep the same portfolio you took before retiring. You took so much risk before retirement, why can’t you play it safe now?

The Geeky Section 🤓

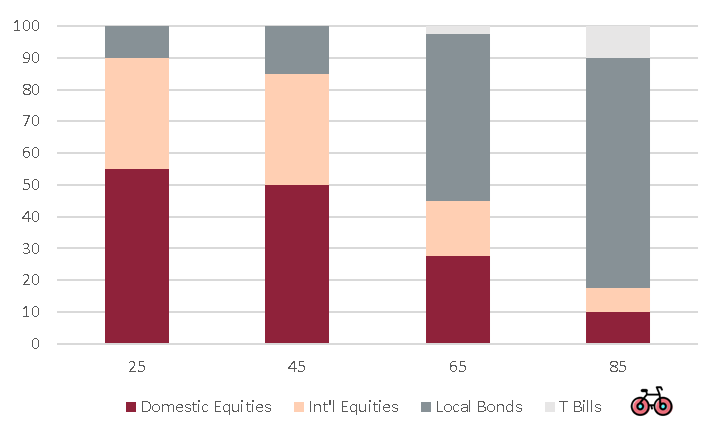
The 50% Local Equity / 50% International Equity Portfolio is compared against:

  • ‘120-age in Equities Rule’ Portfolio: e.g. A 40-year-old French investor will hold 80% in French Equities and 20% in French Bonds. A variant is added by splitting the Equities equally into French/International.
  • A Static 60/40: The French investor will have 60% in Equities, 40% in bonds. A variant is added by splitting the Equities equally into French/International.
  • A Target-Date Fund: With glide-path allocations, but most of it being in domestic securities, particularly at retirement where the International component is anecdotal. You can see the allocations below.

Should you invest 100% in Equities during retirement?

You probably shouldn’t. Here are 6 aspects, where I disagree with the paper’s assumptions and conclusions.

1. Equities: The 35-50% Home Bias Has No Legs

The paper recommends a very strong home bias, no matter the country you invest from.

The baseline is 50%, while 35% is the sweet spot. This home bias is fine from a U.S. perspective, given its dominance in the markets. In fact, the paper does an excellent job of making U.S. investors aware of currency diversification benefits, and any global investor of the risks with investing only in domestic stocks. This tilt may also work for commodity-driven countries like Canada or Australia, as it acts as a diversifier. The study results may be potentially influenced by some of those countries – as they are some of the longest or the historical factor exposure. 

The real gems in any paper – a lesson I learned in my first years on Wall Street – often lie hidden within extensive appendices and sensitivity analyses. Yet again, the devil’s in the details.

Why? The appendix sheds light on the magnitude of the home bias advantage. (dive into the 🤓Geeky Section for the nitty-gritty)What are the incremental savings you’d need to put aside during your working life if you just went for Golden Retriever Portfolio🐶 ? Merely 6% more than a 50/50 portfolio, a margin that is statistically insignificant – even before addressing the other flaws of the study. What are the consequences of implementing the recommended strategy? Massive, from a non-US perspective, especially in Europe (See 🤓 Geeky Section). 

Bottom line: the paper proves that a 100% domestic portfolio is detrimental. But, there is no justification in the data nor from the authors’ narrative that any bias has benefits.


The Geeky Section 🤓

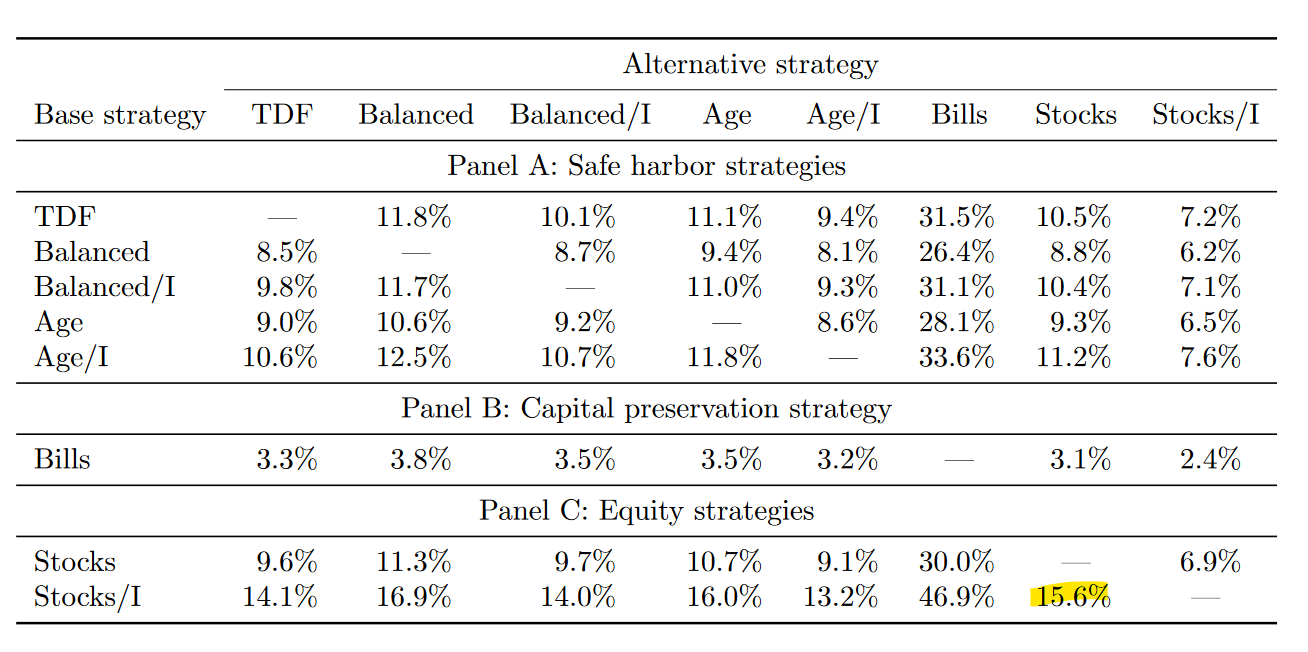
The below tables show the savings that an investor would need to deploy over his entire working life to produce the same impact, should he deviate from the Base Strategy (first column). The study baseline savings rate is 10%. What should you look at?

  • ‘Stocks/I’ – is the 100% Stocks with 50% Domestic / 50% International Allocation
  • ‘Stocks’ is the 100% Domestic Stock Allocation.

In the first table, the authors argue against a 100% Domestic Portfolio. If the Base Strategy is ‘Stocks/I’ (50/50 Portfolio) the investor would need to put aside a massive 56% more savings (15.6% vs. 10%) if he were to invest just in domestic stocks. The incentive to diversify globally is undeniable.

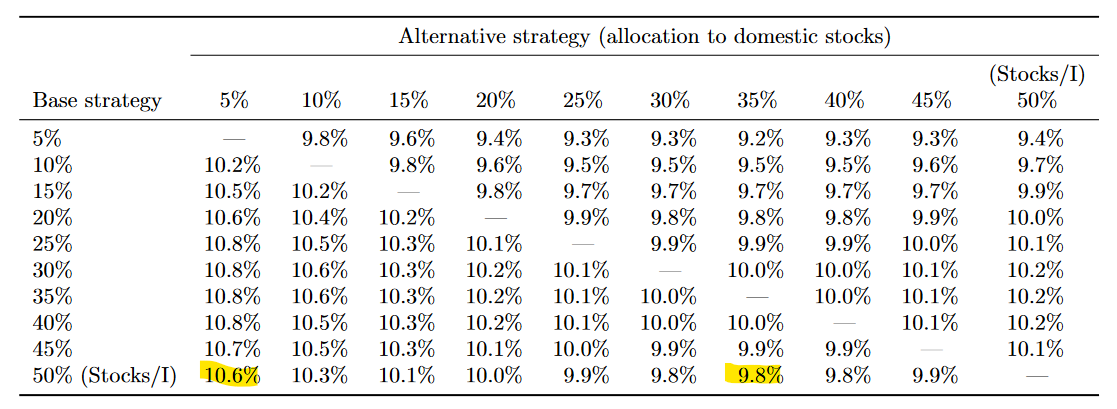
What about the case for some domestic bias? The appendix of the paper contains alternative asset allocations (not only 100% Domestic Stocks vs. 50% International/50% Domestic).

What we can read is that while the base case savings are still 10%, there is a 2% decrease in required savings if an investor reduced domestic stocks from 50% to 35% (9.8% vs 10%). So, a marginal decrease from 50% is even welcome. But, only a 6% increase (10.6% vs 10%) in required savings is needed to compensate for the decrease of domestic stocks allocation from 50% to 5%. In essence, statistical noise. Recall that the argument in favour of international diversification in the first table was ~10x stronger 56% more savings vs 6% more savings here. The paper does not prove any benefit of domestic stocks.

What about the theoretical perspective? The inflation narrative backing domestic bias is very weak. While it may have held true in the past (local firms served local markets), it lacks justification in today’s globalised and specialised economies. For example, pretty much the entire Danish Stock Market essentially serves obese people outside Denmark.

But, the case against home-bias comes also indirectly from the paper itself. 13 out of 38 countries in this sample had 80%+ declines, and some never recovered. Today, most European Markets are concentrated in a few firms/sectors and represent below 1% of global market capitalization. Greece has half of its market cap in just 4 banks that have been bailed out in the past. Would it be reasonable for the average investor to bet on Lithuanian or Portuguese Equities? At best, markets may sometimes not be liquid enough. At worst, it’s not hard to imagine a couple of local companies/industries derailing your retirement.

2. Bonds: Where academia ends, and real world Begins.

For anyone who managed Fixed Income Portfolios in their careers, seeing Argentina or Turkey amongst Developed Countries will raise eyebrows 🤨. It’s not because their agriculture labour share dropped below 50%, or they joined the OECD that makes their Fixed Income markets comparable to the U.S. In the study you have the same likelihood to be in a U.S. or another country’s investor’s shoes, adjusted for length of the data series. Over 25% of the observations come from South America, the Middle East, or Eastern/Southern Europe. Are these Bonds acting like true diversifiers, or become an additional source of correlated risk (see 🤓 Geeky Section below)? Can they be used in ‘alternative world’ simulations for a U.S. Investor? How much do high correlations in these Emerging Markets skew overall Equity/Bond dynamics? Even Southern Europe (although technically developed) should ideally have some sovereign risk diversified away, as recent history has shown. Best market practice for Investors in some countries may e.g. include a basket of currency-hedged G-7 Bonds to reduce volatility and credit risk. In other similar papers, including from Dimson, Marsh, and Staunton the samples – while not perfect – are much more reasonable.

Bottom line: this paper highlights a massive gap between academics and real-world finance. Such research would greatly benefit from validation of market practitioners to ensure relevance and accuracy.


The Geeky Section 🤓

The comparisons with traditional portfolios (as designed by the study) are not appropriate outside a few core Developed Countries like the U.S., the UK or Canada – The TDF, the local 60/40 or local 120-age Equity Portfolios have most/all of their assets in local Equities/Bonds making a 50% International Equity 50% Local Equity Portfolio a very attractive proposition, even for sceptics like me. If you’re retired in Turkey or Greece, would you rather have 50%-70% of your assets in Junk Bonds that may quickly lose value or diversify your risk with high quality U.S. Blue Chips that can hedge inflation? For a lot of smaller/unstable countries (yet part of OECD or having below 50% labour participation in agriculture, as per authors’ definition), the choice seems rather a no-brainer.

3. Equity Correlations: data From a world that doesn't exist

The authors observed a 30-year correlation of just 0.35 between domestic and international stocks. According to Bridgewater, correlations were around 0.35 from 1850 to 1980, which ties out with the paper’s data as most of its sample covers that period. Since then, world exports surged, the Euro was introduced, and correlations doubled to 0.7 (see 🤓 Geeky Section below). High correlations per se are not an issue for long-term investors, as they don’t capture the magnitude of returns, thus preserving diversification benefits. However, they matter a lot more in the consumption phase, as the sequence of returns risk is very real. In essence, globalisation makes the Equity Asset Class more fragile as a whole. This raises a key question: why risk everything on one asset class? A resilient portfolio might include diverse, low-correlation assets like Real Assets, Alternatives, Inflation-Linked Bonds, Treasuries with varying duration profile, or Corporate Bonds.

Bottom line: Two-thirds of the paper’s data reflects an outdated world. Today’s globalised economy makes the Equity Asset Class more fragile as a whole, and demands more robust portfolios.


The Geeky Section 🤓

The chart below from Bridgewater shows equity correlations across countries against the size of exports as a percent of the global economy back to 1825. The surge of globalisation in the postwar era under US dominance, with rising trade and capital ties between countries globally, has led to unprecedented high correlations among the equity returns of different countries.
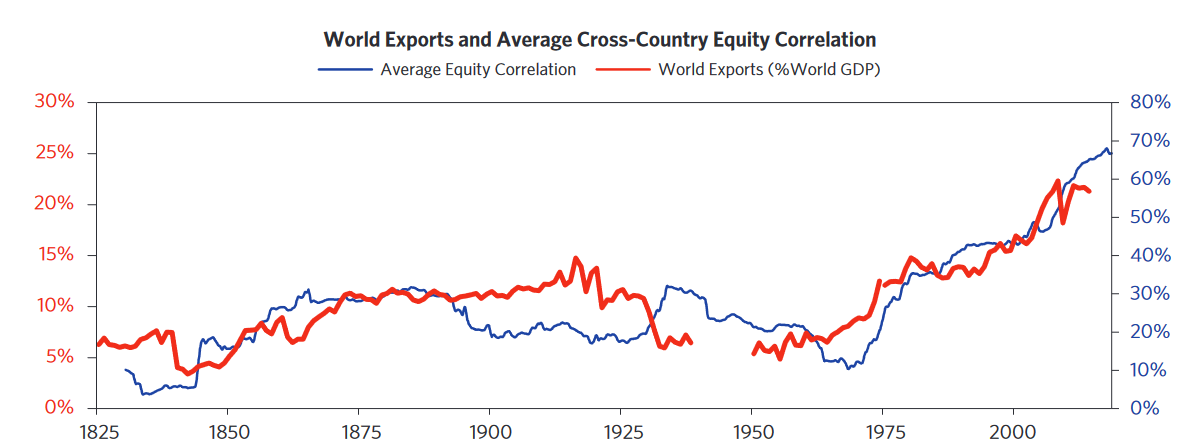
 

4. The data: May require Adjustements

I do agree with the authors in preserving all events, as inflation affected Bond returns almost equally until 1950 and from 1950 to 2000. But, the entire sample seems to be disproportionally driven by a couple of tail events that other researchers have adjusted to make the conclusions more applicable in the real world (see 🤓 Geeky Section below).

Bottom line: Some sample metrics are very unintuitive. For example, the all-country sample average Bond volatility is two times higher than for Equities.


The Geeky Section 🤓

Germany Skewed Overall Numbers – While this paper omits the overall figures, the same dataset was published in the prior paper – which included the researchers’ data-cleaning project – including the overall figures. Overall volatility for all ‘Developed Market’ Bonds (10.81) is almost twice as high as for Equities (5.59). This is possibly skewed by absurd levels of hyperinflation in Germany (46.30) which other researchers exclude to make the research more appropriate for today’s investors.

Source: Aizhan Anarkulova, Scott Cederburg, Michael S. O’Doherty (The Safe Withdrawal Rate: Evidence from a Broad Sample of Developed Markets)


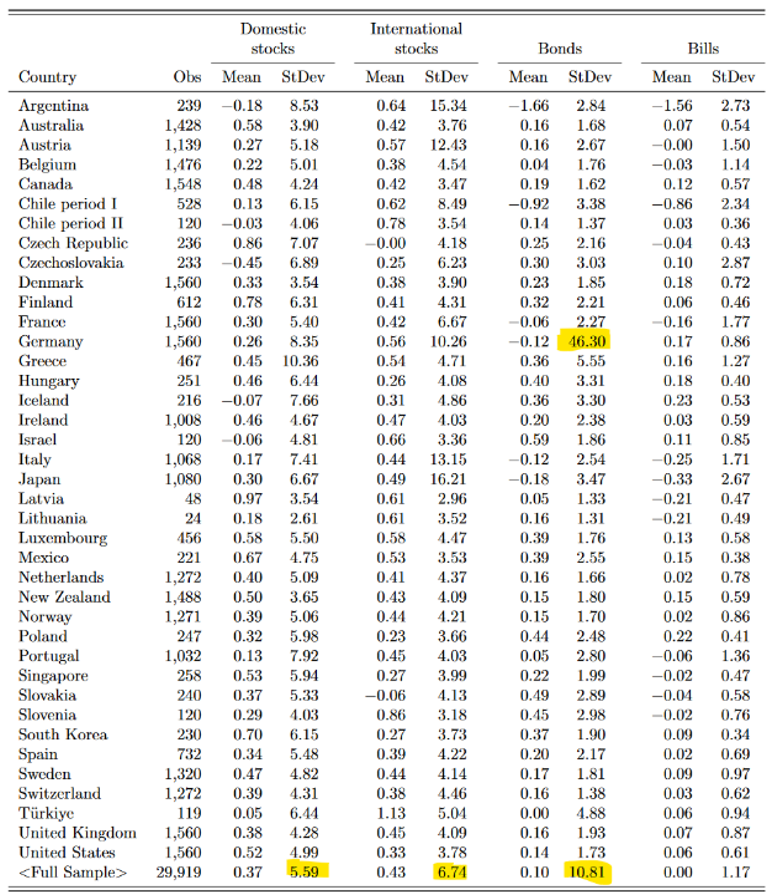
The sample does a great job in stressing for inflationary periods. Average inflation seems to have been as persistent in the first and second half of the century (see averages below). But, even including COVID-19 spikes, today’s inflation data looks different – see my next point.

Sources: Elroy Dimson, Paul Marsh, Mike Staunton (2002), Central Bank / Official Institution Data, Bankeronwheels.com
 

5. Diversification: Future black swan May not be in the data

Financial research is an evolving field, and conclusions often change as new data comes in. While the authors have done a commendable job on the data side, their data only covers the 20th century, and other papers provide a wider perspective. They show that the sample data that we analyse started just after a two-decade long (greatest) deflation in history (highlighted in yellow in the 🤓 Geeky Section below). While I wouldn’t expect the 19th century to be comparable to today, this event – an industrial revolution that massively improved productivity – prompts reflection on possible black swans absent from the study’s scope (noAI didn’t write this article – just yet!). In those cases, lacking Treasuries may cost you dearly. 

Bottom line: This paper is anchored in the 20th century, yet research spanning different eras challenges its findings, revealing instances where Bonds have excelled, even over long investment horizons.


The Geeky Section 🤓

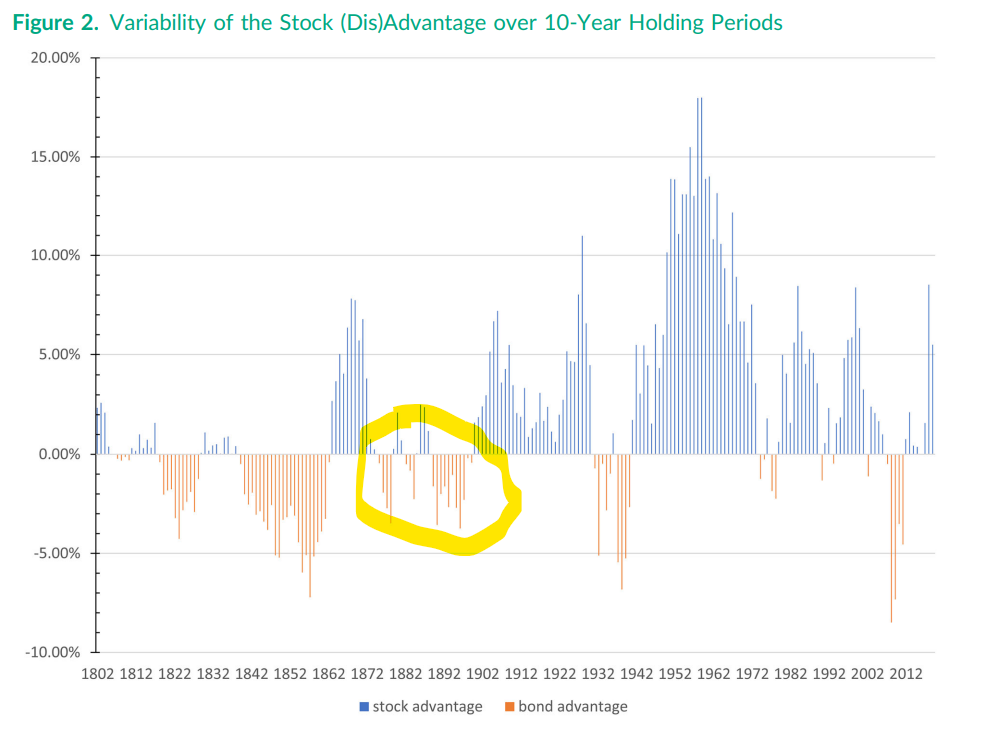
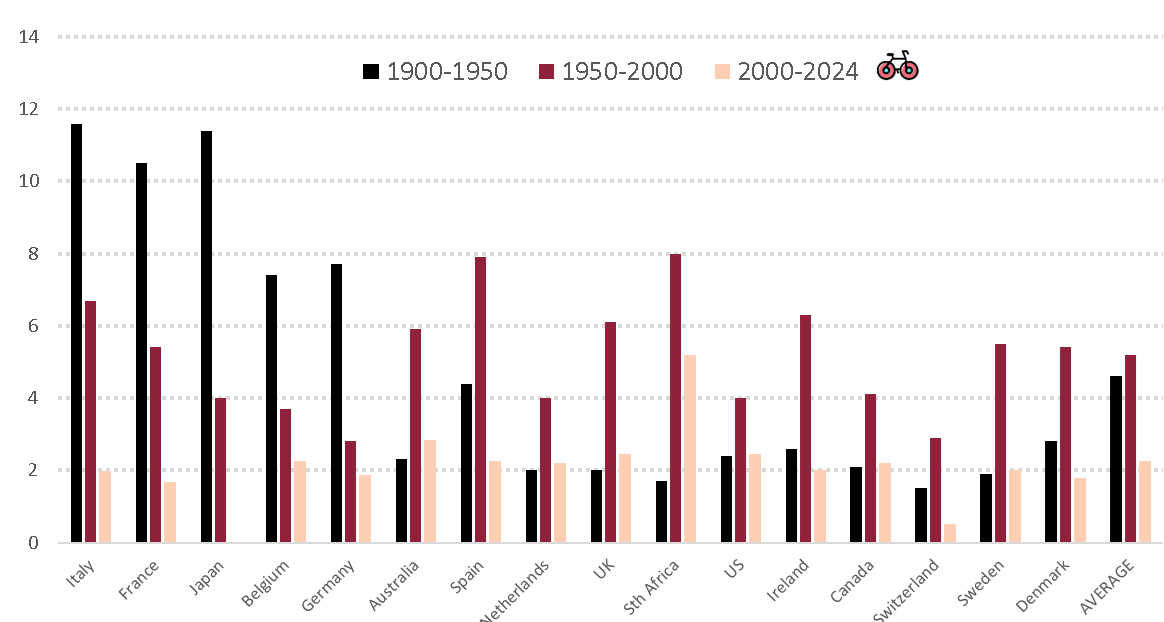
Evidence from other research – Despite the common belief in the superior long-term performance of stocks, Edward McQuarrie’s paper ‘Stocks for the Long Run? Sometimes Yes,
Sometimes No’
 challenge this notion by presenting comprehensive data that goes back to the 19th century. His analysis reveals that outside the exceptional post-World War II period from 1941 to 1981, stocks in the U.S. have not consistently outperformed bonds. This pattern holds true even over extended investment periods, with a two-thirds chance of stocks outperforming bonds over 50 years, leaving a significant one-third chance for bonds to prevail. His analysis put an emphasis on regimes changes like the one highlighted below – a prolonged and global deflationary period caused by the industrial revolution.

Source: Stocks for the Long Run? Sometimes Yes,Sometimes No. Edward F. McQuarrie.
 

6. Real Life: Reasonable is better than rational

The authors admit their study overlooks one of the most crucial aspects of investing – the emotional part. Last year, after conducting over a hundred coaching sessions – including with some of Europe’s financially savviest individuals outside the finance sector – we found that many investors aren’t ready to see substantial drawdowns in the accumulation phase, let alone in their retirement. It’s okay not to maximise wealth, if it’s at the expense of happiness. Or, as Morgan Housel puts it, Reasonable is better than Rational.

Thank you for reading.
Good Luck and Keep’em* Rolling!

(* Wheels & Dividends)

LATEST ARTICLES

HELP US

🙋 Wondering why finding honest Investing Guidance is so difficult? That’s because running an independent website like ours is very hard work. If You Found Value In Our Content And Wish To Support Our Mission To Help Others, Consider:

DISCLAIMER

All information found here, including any ideas, opinions, views, predictions expressed or implied herein, are for informational, entertainment or educational purposes only and do not constitute financial advice. Consider the appropriateness of the information having regard to your objectives, financial situation and needs, and seek professional advice where appropriate. Read our full terms and conditions.