Why Do Portfolio Managers Care About Factors? It’s Not What You Think.


Share:
Banker on Wheels' Easy Ride to Factor Investing - Part 1
Welcome to Part 1 of Bankeronhweels.com Guide to Factor Investing.
My first job on Wall Street was about modelling Hedge Funds Strategies – CTAs, L/S Equity or arbitrage strategies. In the late 2000s, Factor Investing was en vogue. But, even then, factors’ main use in Asset Management wasn’t to achieve higher future performance.
Most portfolio managers, and their risk departments, use risk factors to understand past performance attribution. Why did our portfolio outperform? Which risks did we take? Was it due to our skill?
Today, Alex will introduce two portfolios he simulated to determine how brilliantly a few factors explain past performance.
KEY TAKEAWAYS
- The strategies of your ETFs matter. Two very well-diversified portfolios can have very different returns.
- On the face of it, it’s complex. It is impossible to pinpoint the exact economic reasons that drive this performance difference.
- But, high-level ETF characteristics, including whether the portfolio is full of small, ‘cheap’, or ‘good quality’ stocks, may explain 95% of the return difference.
- These characteristics are called ‘Factors’. Academics and portfolio managers spent the last 60 years figuring out how they work.
- That’s because they explained how portfolio managers actually added value. Portfolios exposed to these factors have historically had higher returns and better outcome reliability.
Here is the full analysis
Two diversified portfolios. Very different returns.
What explains this massive difference in performance?
A few simple factors
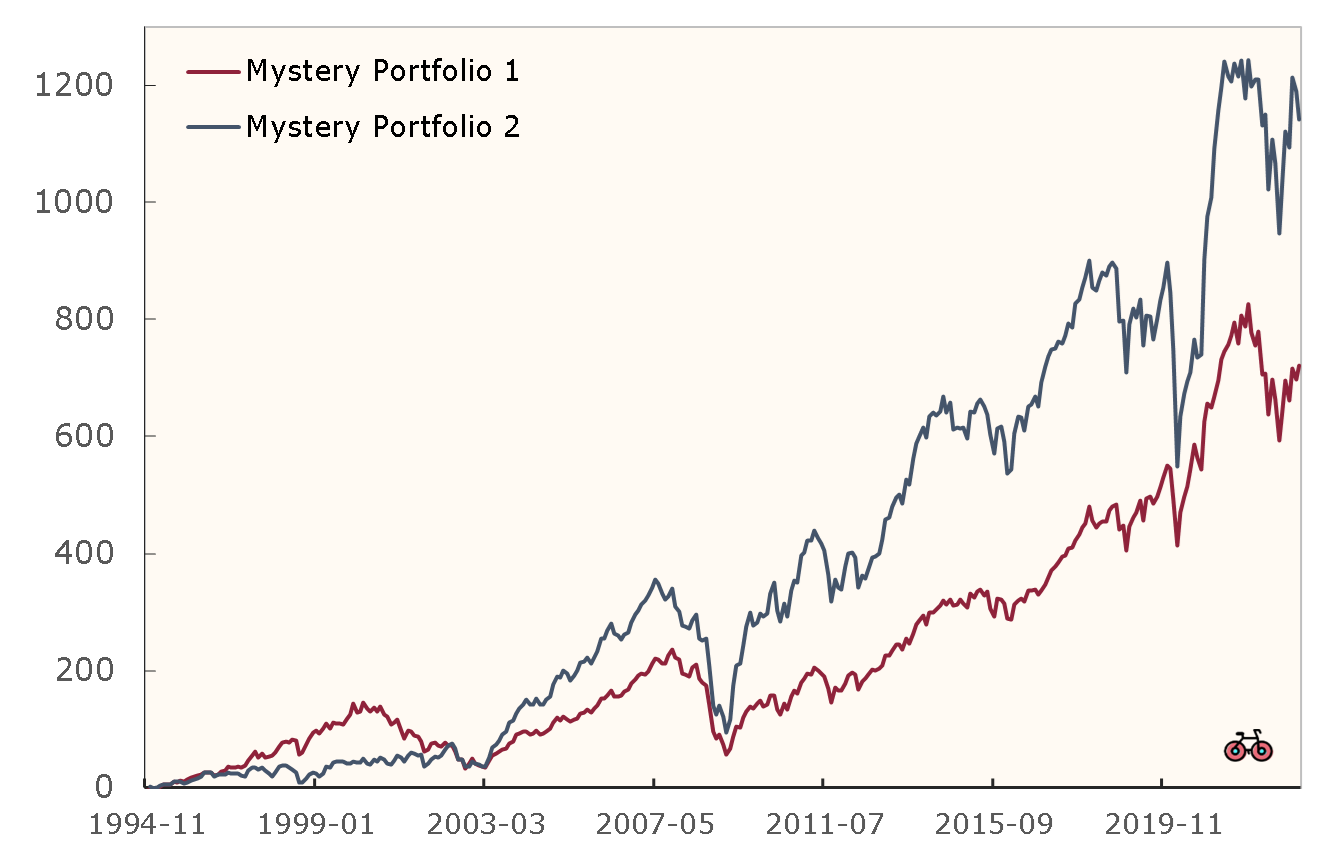
This chart shows the performance of two global stock portfolios that have clearly performed very differently over the last 29 years:
- Mystery Portfolio 1 – had an average return of 7.2%, resulting in 722% cumulative return.
- Mystery Portfolio 2 – had an average return of 9.0%, with a cumulative 1142% return.
Comparison of two global stock portfolios from 1994 to 2023
This seems like an impossible question to answer. After all, each portfolio contains the stocks of thousands of companies which are part of an extremely complex global economy. Pinning down the specific reasons these stocks performed differently seems like a fool’s errand.
What if I told you that the performance difference is due to just a handful of very simple portfolio characteristics, also called factors?
❤️🐶 Shop & Support - Celebrate our 4th anniversary! 4️⃣🎂
Spread the Golden Retriever Wisdom Across Europe & the UK 😎
Banker On Wheels is 4 years old! To celebrate our anniversary we have launched the official merchandise store – Shop.Bankeronwheels.com. You can now get your favourite Golden Retriever, or your factor tilt on a coffee mug or a T-Shirt while supporting our cause! All profits are reinvested into creating more educational content. Alternatively, you can also buy us a coffee. Thank you for all your support ❤️

What do you mean by factors?
It's Like watering your plants
In everyday language, a factor is something that influences an outcome. For example, adding more compost and water to my small backyard garden yields a larger quantity of vegetables 🌱
The Geeky Section 🤓
In the world of mathematics, we can write this statement more precisely using a simple linear equation:
yield = ß compost ∙ compost + ß water ∙ water + α
The coefficients ß compost and ß water tell us how much a change in the quantity of added compost or water, respectively, influences the vegetable yield.
α – is what we call below the residual.
We have just written our first factor model!
Can factors help me understand portfolio performance?
Yes, the explanation may be simple
Compost and water are factors.
Part of the yield of my garden is explained by how much compost and water I add and a part is explained by other factors (e.g., rainfall, sunshine, pigeon appetite) that are not explicitly included in our model and are a residual.
If the residual is large, factors influencing the vegetable yield may not be included in our model. This means our model might be a bit simplistic, and there might be room to improve its accuracy by incorporating additional variables, like sunlight, soil quality, or pest control.
But how can I use these models?
“All models are wrong...” – George Box
Since the 1960s, financial economists have developed various factor models. Before describing some of them, let’s highlight three important caveats. Factor Models help you explain:
- Portfolio Excess compared to a risk-free asset – e.g. US Treasury bills. For example, if the portfolio return was 8% and US treasury bills yielded 3%, factor models may explain up to 5% of the return difference.
- Returns over a long-term time horizon, in specific intervals – usually monthly.
- Returns of diversified portfolios, which are not dominated by company-specific events (also called idiosyncratic risks). As a rule of thumb, a portfolio is diversified if it contains at least a few dozen stocks. Otherwise, the explanatory power may be much lower.
The Geeky Section 🤓
You could slide and dice Global Markets by Countries and Industries. That’s what’s most intuitive for a lot of investors, and the traditional performance attribution used for active benchmarked funds decomposes the excess returns into a stock-picking contribution and a sector or regional contribution. We showed how Developed and Emerging Markets Indices are constructed, and how industries influence your portfolio. However, this method fails to properly explain the portfolio risk drivers. The below risk factors can explain it.
Advertisement

Advertisement

The only six equity factors you need to know.
Let’s plant the first seed
“Cool story, George. Where’s your Nobel Prize?” – William Sharpe (probably)
Four academics independently introduced what is now called the capital asset pricing model (CAPM) in the early 1960s. William Sharpe was awarded the 1990 Nobel Memorial Prize in Economic Sciences for this contribution.
#1 The Market Factor (think the GLOBAL ETF)
MKT is the market factor – the excess return of the entire stock market. It was a significant first step to explain portfolio returns. Some studies found it explained a significant portion of portfolio returns.
The Market Factor is like water for plants: essential for growth, providing a fundamental nourishment for flourishing investments. Yet, the CAPM was a bit simplistic. It’s like trying to explain vegetable yield with just water 💦.
The Geeky Section 🤓
The CAPM only uses a single factor to explain the excess return R of an Equity portfolio, over the risk-free rate:
R = ß MKT • MKT + α
Let’s say that our portfolio is more aggressive and has ß MKT =1.5. Under the CAPM, if the return of the market in excess of the risk-free rate, like Treasury Bills, changes by 10%, then the expected return of our portfolio is 15%.
For this work, William Sharpe was awarded the Nobel Memorial Prize. His work expanded on the work from Harry Markowitz that demonstrated that single stocks’ performance are irrelevant. What is important is their impact on the portfolio. Here is a great book about the history of indexing and the financial theory behind it.
That’s all elegant and simple. Too bad the market is more complex.
“Cool story, George. Where’s your Nobel prize?” – William Sharpe (probably)
Saying that the CAPM was wrong is, of course, an exaggeration. A less exciting but more accurate statement is that empirical research in the 1980s showed that there are certain portfolios whose excess returns are not adequately explained by the CAPM.
How do you make factors shine? Add Sunlight & Pest Control.
In 1992, Eugene Fama and Kenneth French added two more factors to the CAPM, resulting in a three-factor model. They added Sun ☀️ and pest control 🦠 to the mix.
The Geeky Section 🤓
R = ß MKT • MKT + ßSMB • SMB + βHML • HML+ α
The SMB (exact definition) and HML (exact definition) factors are also excess returns between two portfolios, but they are not taken with respect to the risk-free rate like the MKT factor. Let’s see below how it works.
Advertisement

As of 29/03/2024, Interactive Brokers offers rates up to 4.738% (GBP), 3.445% (EUR) and 4.83% (USD) on cash.
Advertisement

As of 29/03/2024, Interactive Brokers offers rates up to 4.738% (GBP), 3.445% (EUR) and 4.83% (USD) on cash.
#2 Size Factor (think Small Caps)
SMB stands for “small-minus-big” and is called the size factor. SMB is roughly defined as the excess return between the 50% of the smallest companies and the 50% of the biggest companies in the stock market.
#3 Value Factor (think ‘Cheap’ Stocks)
HML stands for “high- minus-low” and is called the value factor. HML is defined as the excess return between the 30% of companies with the highest book-to-market (BM) ratio and the 30% of the companies with the lowest BM ratio. In essence, HML captures the difference in returns between “cheap” (i.e., with a high book-to-market ratio) and “expensive” (i.e., with a low book-to-market ratio) companies.
Even though the Fama-French three-factor improved the CAPM, there were still portfolios whose returns it could not explain well. More candidates popped up.
Soil Quality, Rainfall… Pigeon Poo?
Even more factors ended up useful. For example, soil quality helps, especially for good wine. 🍷
#4 Momentum Factor (think 'winners’)
WML (“winners-minus-losers”) factor was added to the Carhart four-factor model (1997). It is commonly called momentum and is defined as the excess return between a portfolio of stocks with the highest returns and a portfolio with the lowest returns over the previous 12 months.
#5/6 Profitability and Investment Factors (think profitable and robust companies)
RMW (“robust-minus-weak”) and CMA (“conservative-minus-aggressive”) factors were introduced in the Fama-French five-factor model (2015) and relate to company profitability and investment measured as the growth in assets.
“Now we have a zoo of new factors.” – John Cochrane
Now, many more potential factors have been identified by academic researchers, resulting in a “zoo” of factors.
But at some point, it becomes pigeon poo – noise, rather than signal. 🐦
Even though pigeon poo and vegetable yield may be correlated, chances are it’s by pure randomness.
Or, a new factor is already captured in the previous factors – is adding the rainfall factor useful, or can we combine it with our watering system since it’s essentially all water?
The Geeky Section 🤓
Factors are typically discovered empirically by trying to identify companies with common characteristics whose returns cannot be explained well by existing factors. But there is no consensus about the factors, and some financial firms may use other definitions (e.g. Other Defensive/Quality Factors, Low Beta/Volatility).
Academic researchers have identified several hundreds of potential factors, making it impossible for the average investor to decide which factors should be considered.
The authors of Your Complete Guide to Factor-Based Investing Book were amongst the first in the industry to come up with a six-point checklist that allows investors to cut through the noise. A worthwhile factor should:
- Add explanatory power to existing models and have provided a premium historically.
- Be persistent over time.
- Be pervasive across geographies and/or asset classes.
- Be robust to slight variations of their definitions.
- Be investable after considering additional costs.
- Be intuitive, i.e., there must be risk-based and/or behavioural explanations.
With the few key factors, how much can be explained?
In this series, we will not go beyond a few key factors, as these already explain over 90% of returns.
returns using the CAPM, THREE AND SIX-FACTOR models.
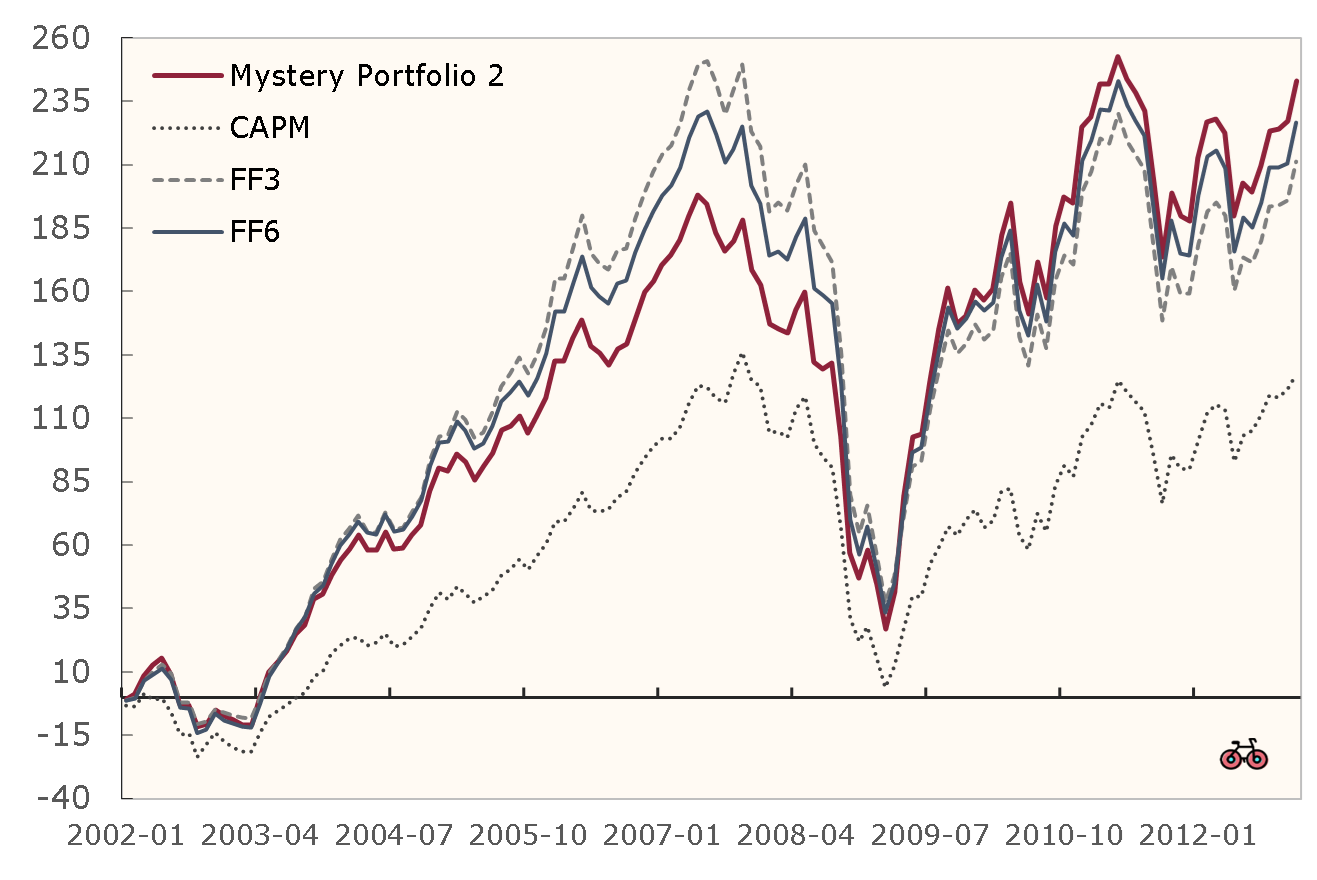
In the figure above, we show the returns of Mystery Portfolio 2 from 2002 to 2012, which includes the recovery from the dot-com bubble and the 2008 Great Recession. We also show how the CAPM, the three-factor and six-factor models reconstruct these returns. The CAPM does a particularly poor job of explaining returns in this example. The three-factor model significantly improves, while the six-factor model improves the reconstruction only slightly.
In my view, it is extremely impressive that the returns of a portfolio of thousands of stocks from all over the world can be reconstructed so accurately with only a handful of factors.
WHY ESG Outperformance Narratives are wrong
Factors will help you in explaining the lack of alpha. Or, to understand why ESG investing, adjusting for risk factors, is poised to underperform.
Imagine a gardener who waters plants based on tides
Would you hire him?
The same may apply to portfolio managers.
Now, imagine a gardener who pitches you a new method of watering plants. The Earth completes one rotation approximately every 24 hours. As it rotates, different parts of the Earth face the Moon and experience its gravitational pull, leading to tides. This one argues that watering in line with this short cycle will increase vegetable yield.
But the Water, Sun, Soil, and Pest Control model already explains 99% of the results. Are tides a systematic risk for plants? Would you hire him?
The Geeky Section 🤓
Some portfolio managers generate excess returns. They do it because they take additional risks. Although PMs may think of them as overallocation to a country or sector, the best way of explaining them is to capture excess returns through our factor models. Here is how it works.
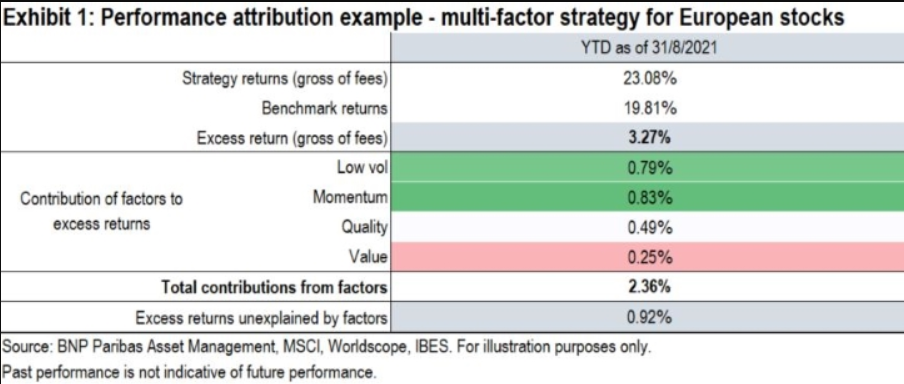
Above is an example from BNP Paribas showing how an Active Portfolio performance (23.08%) can be deconstructed into:
- Portfolio Return that is attributed to Benchmark Return (and its own risk factors) – 19.81%.
- Excess return that is attributed to excess risk taken from different factors (Low volatility, Momentum, Quality or Value) – 2.36%.
- Excess return that is unexplained by factors (actual portfolio manager outperformance, or sometimes it could be due to shortcomings of the risk model) – 0.92%.
From Bankeronwheels.com
Get Wise The Most Relevant Independent Weekly Insights For Individual Investors In Europe & the UK
Liked the quality of our guides? There is more. Every week we release new guides, tools and compile the best insights from all corners of the web related to investing, early retirement & lifestyle along with exclusive articles, and way more. Probably the best newsletter for Individual Investors in Europe and the UK. Try it. Feel free to unsubscribe at any time.
🎁 In the first email, you can download a FREE comprehensive 2-page checklist to construct & monitor your portfolio and clean up your personal finances.
Conclusion
What about future outperformance?
OK, now onto the tricky stuff.
Today, we saw how past performance can be explained by just a few factors.
But why does a relatively small subset of all portfolio managers on Wall Street, specifically focusing on what’s called ‘factor investing’ use this method to construct portfolios?
Can they outperform the market? Let’s look at its appeal in the second article of this series.
Also, let’s find out more about our Mystery Portfolios!
[Next episode coming soon – Subscribe 📧 to get posted when it’s available]
PART 2 (CominG soon)
Good Luck and Keep’em* Rolling!
(* Wheels & Dividends)


Cash Is Not Enough: Why Hold Bond ETFs Despite Price Rollercoasters.


The Truth About €1 Million Broker Guarantees (Updated With Trading 212 Cap)


Halifax Share Dealing Review – Similar To Lloyds With SIPP On Top


Lloyds Share Dealing Review – Old School But Ticks The Boxes For Golden Retrievers

DEGIRO Review: A Transparent Leader In Low-Cost Investing


Weekend Reading – BlackRock Launches New iBonds, Truth About €1M Broker Insurance & BOW is 4 years old!
HELP US
🙋 Wondering why finding honest Investing Guidance is so difficult? That’s because running an independent website like ours is very hard work. If You Found Value In Our Content And Wish To Support Our Mission To Help Others, Consider:
- 📞 setting up a coaching session
- ☕ Treating us to a coffee
- 🐶 Purchasing Our Official Merchandise
- ❤️ Exploring Other ways to support our growth, both financially and non-financially.
DISCLAIMER
All information found here, including any ideas, opinions, views, predictions expressed or implied herein, are for informational, entertainment or educational purposes only and do not constitute financial advice. Consider the appropriateness of the information having regard to your objectives, financial situation and needs, and seek professional advice where appropriate. Read our full terms and conditions.