
9 Charts That Spell Disaster for Your Cousin’s Stocks

Trying to beat the market is an entertaining activity.
You can try stock-picking yourself, or pick a professional portfolio manager.
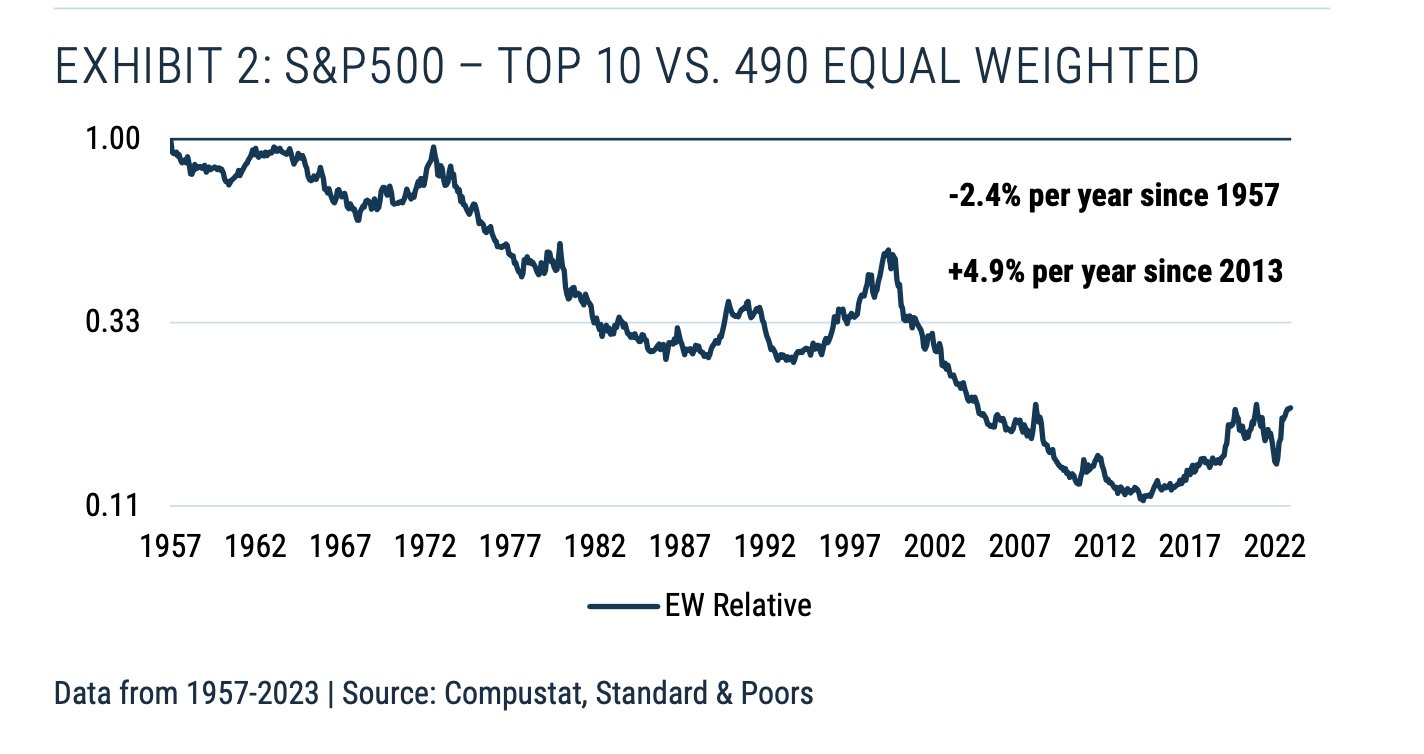
It may look easy. Today, the trend is to pick within recent winners. Consider this: from 2013 to 2024, the top 10 U.S. stocks eclipsed the rest of the S&P 500 pack by a whopping 4.9% annually.
But, what if you’re getting yourself into an investing minefield? What’s the potential damage if you pick a loser? Especially if you do it in an overheated market?
Sure, your stock-picking cousin may get lucky in the short term. But, here are nine charts showing why – in the long run – he will underperform.
KEY TAKEAWAYS
- Picking a winning stock is not a 50:50 game. 6 out of 10 Stocks are losers. Another 3 out of 10 barely beat Treasury Bills.
- So, where did the immense wealth of the stock market come from? Remarkably, just 4% of stocks have generated all investor wealth since 1926.
- Should you pick recent winners? From 2013 to 2024, they outperformed by 4.9%. But that’s an anomaly. Historically, the Top 10 stocks underperformed the rest of the S&P 500 by 2.4%.
- Should you pick rising stars? This is where the 10 or 100 baggers are. But, 60% of Tech companies plummet by 70%. And never recover.
- Hiring a Professional Portfolio manager? They are more skilled, but their performance doesn’t beat the market after fees.
- Yes, markets may be inefficient. But you’re even less efficient in exploiting it.
Here is the full analysis
#1 A FEW WINNERS TAKE IT ALL
4% Of Stocks Carry The Entire Market
96% of stocks created no wealth
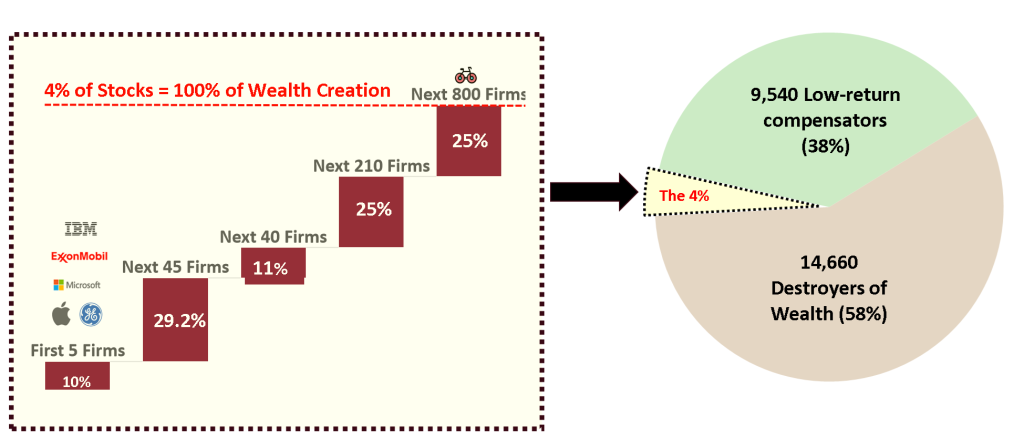
Why not start with the most depressing number? In 2017, Hendrik Bessembinder analysed the performance of 25,300 US Stocks, looking at lifetime stock returns from 1926 to 2016. Historically, just 4% of Stocks or c. 1,100 firms listed in America created 100% of net wealth for buy-and-hold investors. What about the other stocks?
6 out of 10 (14,600 firms) lost investors’ money. The next 3 out of 10 (9,540 Stocks) were very low-return stocks that offset – on aggregate – those loses. So, on a cumulative net basis, 96% of stocks created zero investor wealth.
Creators vs destroyers of wealth
1.2% of Winners generate 75% of Wealth
The winners are even more concentrated:
- Top 5 Stocks (or just 0.02% of all listed stocks) – ExxonMobil, Apple, Microsoft, General Electric and IBM generated 10.1% of investor wealth.
- Top 50 Stocks (or 0.2%) – captured 39.3% of wealth creation.
- Top 300 Stocks (or 1.2%) – generated 75% of wealth.
- Top 1,200 Stocks (or 4%) – accounted for 100% of net wealth.
Percentage of Wealth Creation For Investors (1926-2016)
| # Stocks | % Market | Net Wealth Creation | Incremental Wealth |
|---|---|---|---|
| 5 | 0.02% | 10.10% | 10.1% |
| 50 | 0.20% | 39.30% | 29.2% |
| 90 | 0.36% | 50.30% | 11.0% |
| 300 | 1.20% | 75.00% | 25.0% |
| 1,100 | 4.00% | 100.00% | 25.0% |
| 10,640 | 42.1% | 117.30% | 17.3% |
| 25,300 | 100% | 100.00% | -17.3% |
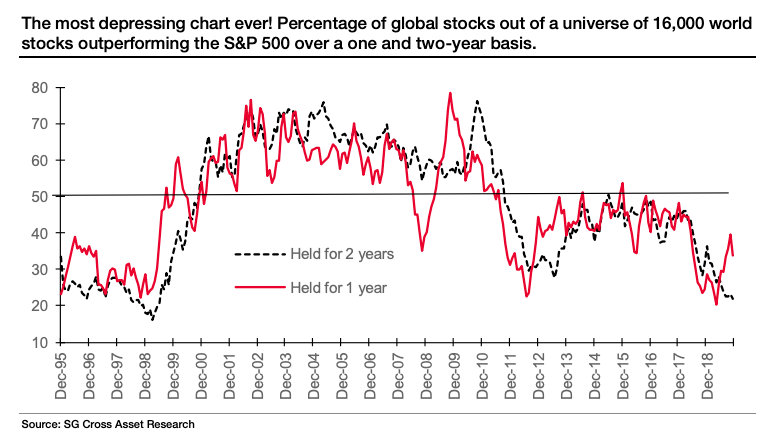
Surely, it's not always like that?
In the short to medium-term, it isn't.
Indeed, there were periods when most stocks even outperformed popular indices. So, why limit ourselves to Buy and Hold and not time the market?
Let’s have a look at the evidence behind market timing, but first, try to see if we can pick the handful of stocks that generate the exceptional returns that lift the overall market.
❤️🐶 Shop & Support - Celebrate our 4th anniversary! 4️⃣🎂
Spread the Golden Retriever Wisdom Across Europe & the UK 😎
Banker On Wheels is 4 years old! To celebrate our anniversary we have launched the official merchandise store – Shop.Bankeronwheels.com. You can now get your favourite Golden Retriever, or your factor tilt on a coffee mug or a T-Shirt while supporting our cause! All profits are reinvested into creating more educational content. Alternatively, you can also buy us a coffee. Thank you for all your support ❤️

#2 Yesterday's Winners may Not be Tomorrow's
It's difficult to pick all-time winners
Winners constantly change (1980 - 2024)
As you may have guessed, compounding plays a big role in those massive gains. But, in the long run, only a few of yesterday’s winners will significantly compound over time.
The below race animation shows individual Stocks’ relative market cap in the S&P 500 Index, with the logos of the TOP 5 winners from the first study. Firms like Apple, Microsoft, GE or ExxonMobil were consistently compounding returns for decades. These firms generated annualised returns of 10-12% since 1926. But they are an exception.
No Stock is Too Big To Fail (1980 - 2024)
Once They Reach the Top, It's Often Too late
The key is to catch stars before their rise.
Companies are born, have their heyday, then recede or die. GE left the TOP 10 in recent years. Prior to 2007, three financial firms ranked amongst the Top 10 – AIG, Citigroup and Bank of America. AIG was rescued during the Global Financial Crisis, while both Bank of America and Citi lost most of their value.
But, Since 2013 RECENT WINNERS outperformed?
Last decade is an exception, not the rule.
If you look at recent history, holding the recent winners was a winning strategy – the largest 10 stocks in the S&P 500 generated an additional 4.9% per year on average. But, this is an exception:
- According to GMO, since 1957, the 10 largest stocks in the S&P 500 have underperformed an equal-weighted index of the remaining 490 stocks by 2.4% per year. Why? Tomorrow’s winners rise, and that’s where most of the wealth is generated.
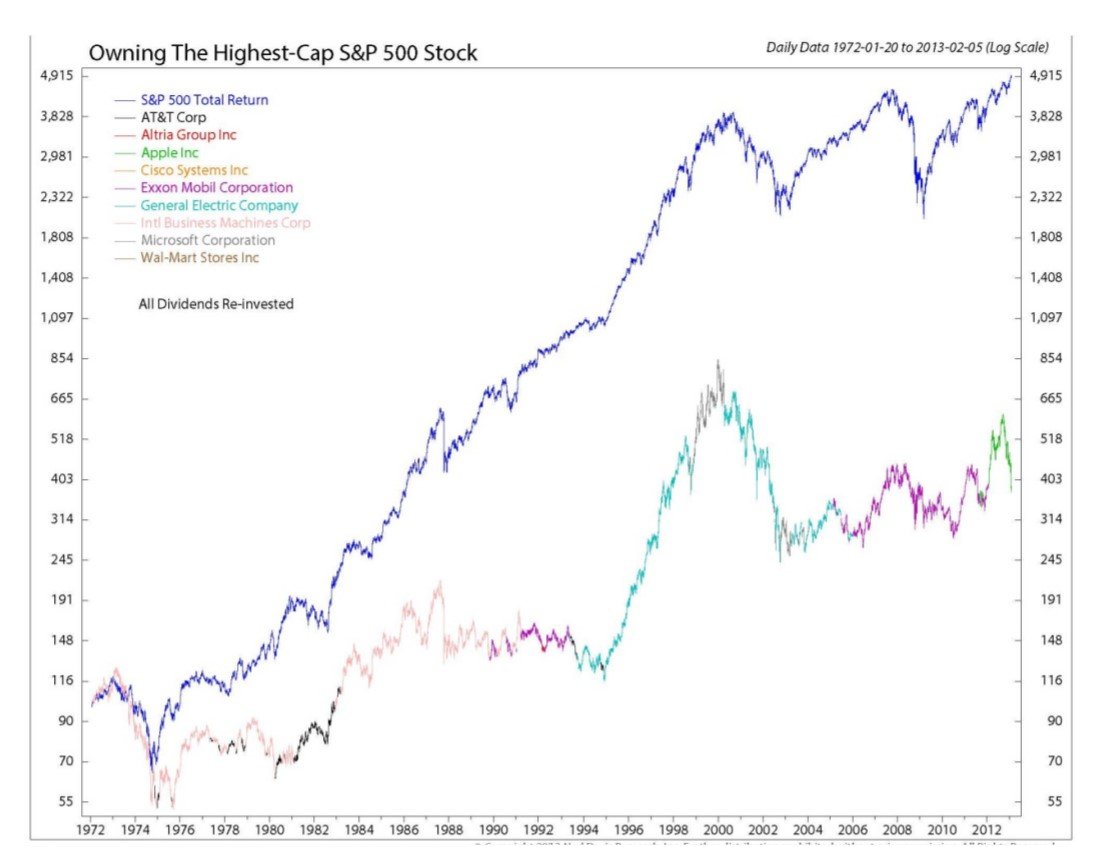
- Here is another proof. Before last decade, what would have happened if you bought the best stock once it took the top spot? According to Ned Davis Research, between 1972 and 2013, the S&P 500 gained approximately 5,000%. The best stock? Just 400%.
So, most of the time, yesterday’s winners are not the best picks to outperform in the long run. Why not catching the rising stars instead?
Advertisement

Advertisement

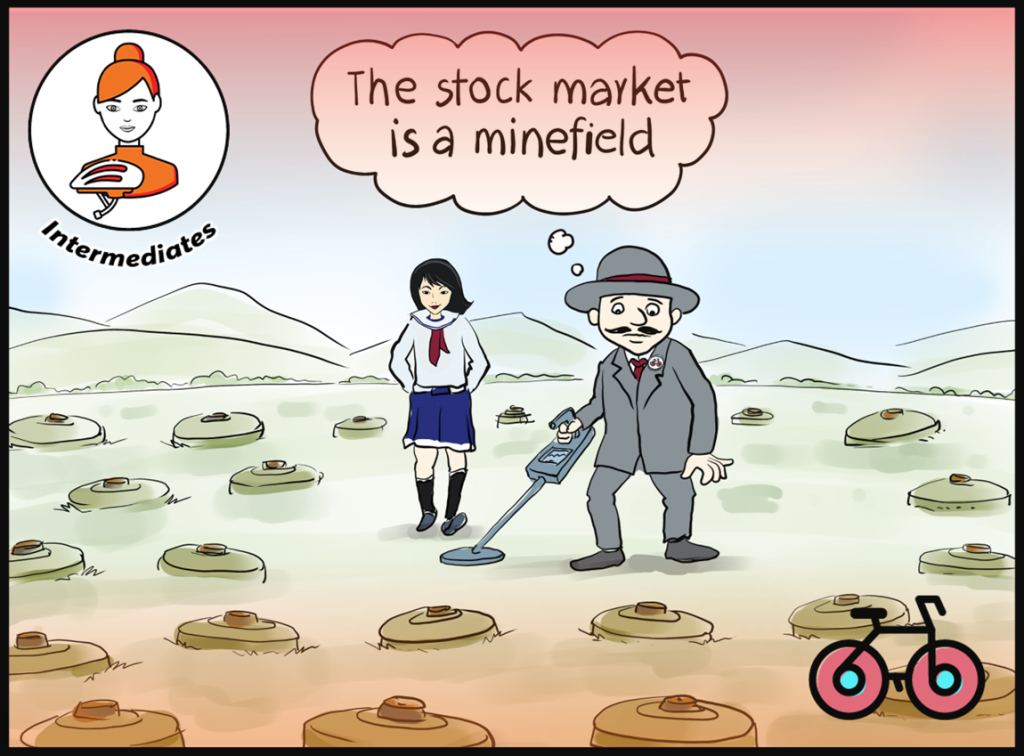
#3 THE STOCK MARKET IS A MINEFIELD
The Coolest Sectors Are The Worst
57% Of Tech Stocks never recover
Catching the rising stars is the most lucrative way of capturing wealth. Tomorrow’s winners are the 10, 100 or 1000 baggers. But the odds are heavily stacked against us. In a capitalistic system, this makes sense. For every Apple, there are dozens of tech companies that no longer exist. But what’s the potential damage if you pick a loser? Especially if you do it in an overheated market?
Percentage Of Stocks with 70%+ Declines & No Recovery
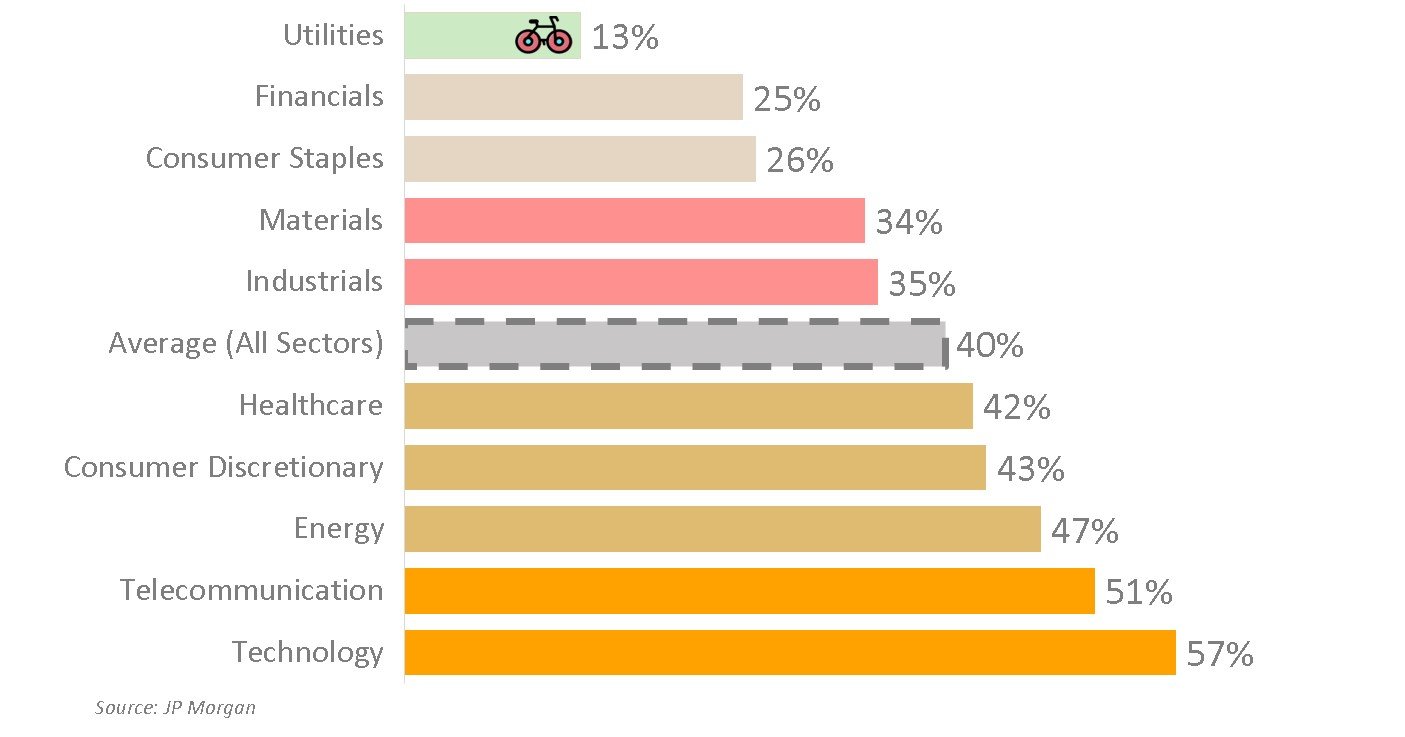
In 2013, J.P. Morgan gave a wider perspective on the risks. Using the Russell 3000 returns since 1980, JPM concluded that roughly 40% of all stocks had suffered a permanent 70%+ decline from their peak value. These are not temporary declines during the tech boom-bust or during the financial crisis, but declines that were not subsequently recovered. For Technology, Biotech and Metals & Mining, the numbers were considerably higher.
#4 IT BECOMES COMPLEX ONCE YOU'RE PREGNANT
Is it worth your most precious resource?
Time is not on your side.
Active vs Passive - Comparison of Portfolio Decisions
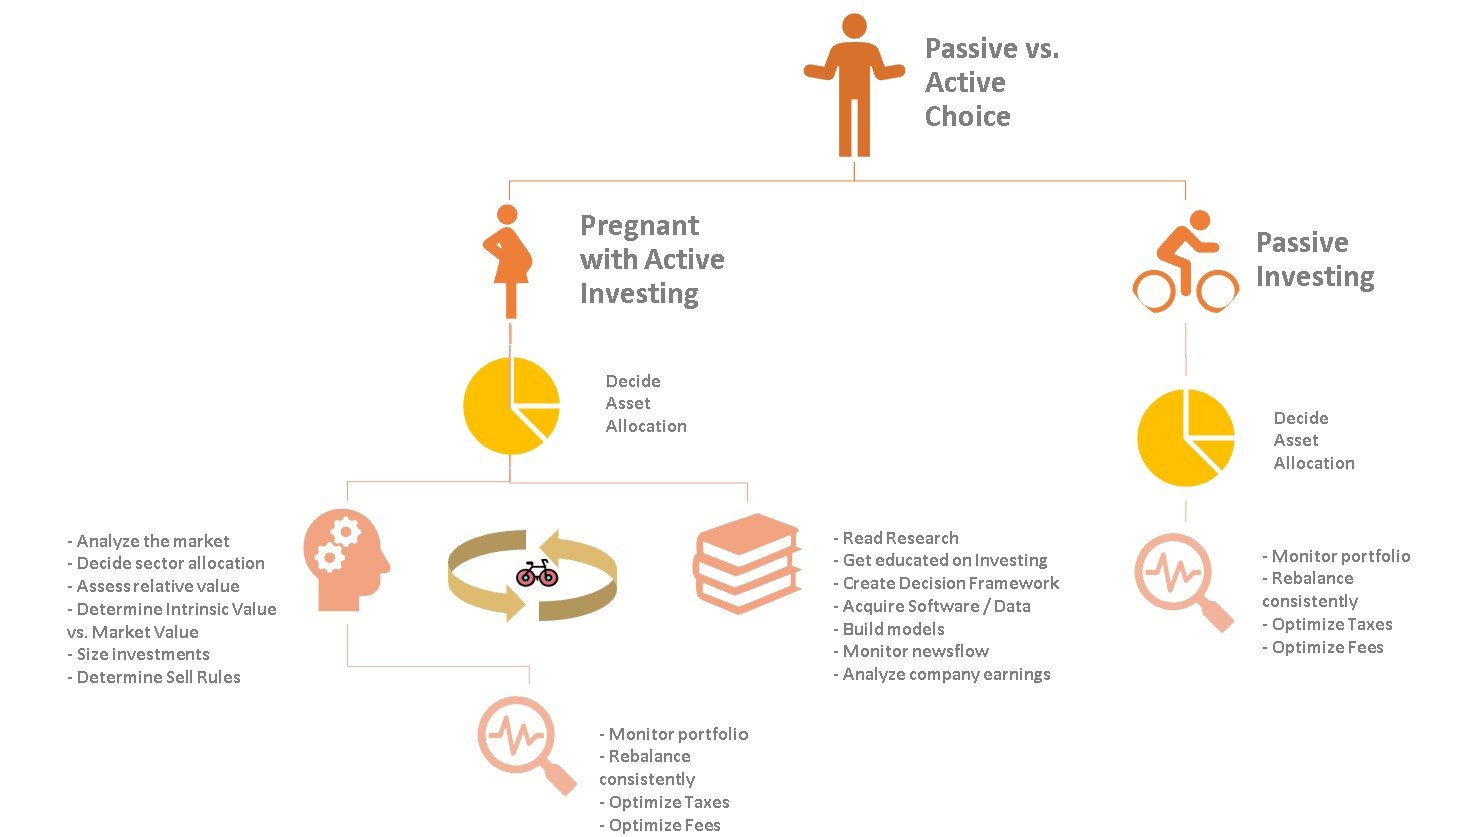
You still want to give it a chance. Here is the practical aspect. Once you become pregnant with active investing, the number of decisions becomes staggering. Take the above recurrent tasks and imagine a decision tree to optimise returns. It may not be worth consuming your most precious resource. Time. But, what about giving your money to professional portfolio managers that spend their entire days on research and have cutting-edge technology?
Advertisement

As of 29/03/2024, Interactive Brokers offers rates up to 4.738% (GBP), 3.445% (EUR) and 4.83% (USD) on cash.
Advertisement

As of 29/03/2024, Interactive Brokers offers rates up to 4.738% (GBP), 3.445% (EUR) and 4.83% (USD) on cash.
#5 Should You Hire A Pro?
You're likely to be the Sucker at the Investment Table
Pros beat the market by 1.3%, Individual Investors lose.
If you cannot spot the sucker in your first half hour at the table, you are the sucker, said Michael McDermott, from the movie “Rounders,” played by Matt Damon. Academic Research confirms, it’s likely to be individuals. Professional Asset Managers are doing better, at the expense of individual investors. Funds managed by professionals outperform the market by 1.3 percent per year. So, given active investing is a zero-sum game, individual investors are net losers.
But You Shouldn't Join The Winners
But after fees, Pros underperform the market by 1%.
But the same research also concludes that their net returns underperform the market one percent. Of the 2.3 percent difference between these results, most is due to expenses and transaction costs. In the long run, these fees will have a material impact.
The Longer You Bet On Them, The Larger Your Losses
Inconsistent returns, and fees compound.
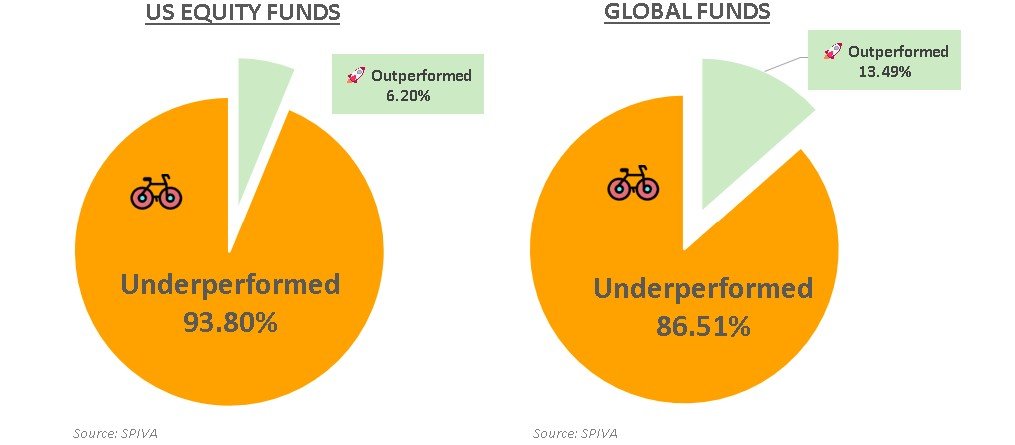
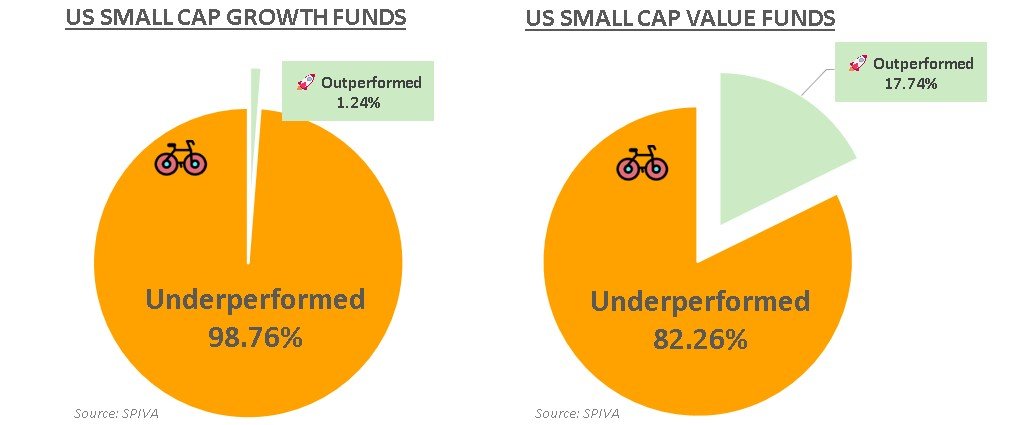
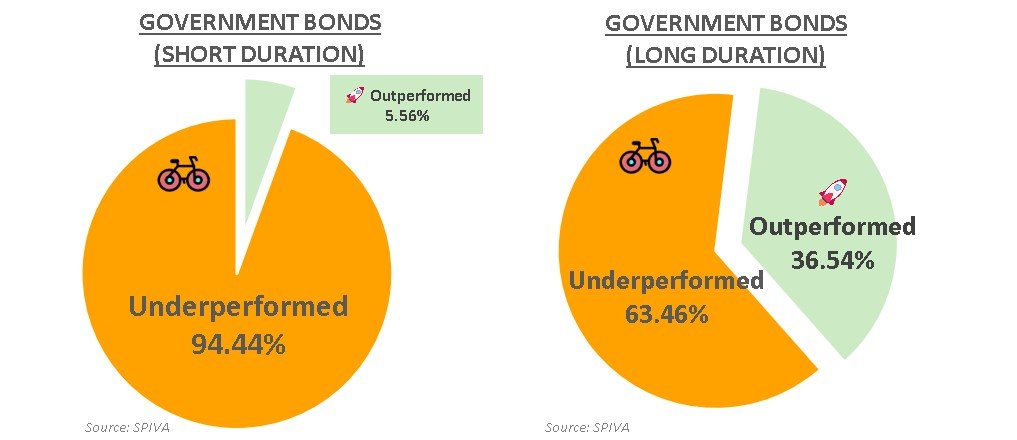
20-Year PERFORMANCE OF Active Funds' Vs. Benchmark (2021)
#6 So, Maybe You Can Time the Market?
What's The Damage of Playing this game?
The market is just too fast.
Perhaps cutting losses could be a more efficient strategy? Well, evidence points out that investors relying on market timing are their worst enemies. Since 1984, 70% of underperformance of the active equity fund investor versus the S&P 500 occurred during 10 market sell-offs in which investors withdrew money. Missing some of the market’s best days has devastating results. According to J.P. Morgan, six of the 10 best days for the market occurred within two weeks of the 10 worst days.
Value Of A $100,000 Investment After 20 Years (Jan'01 - Dec'20)
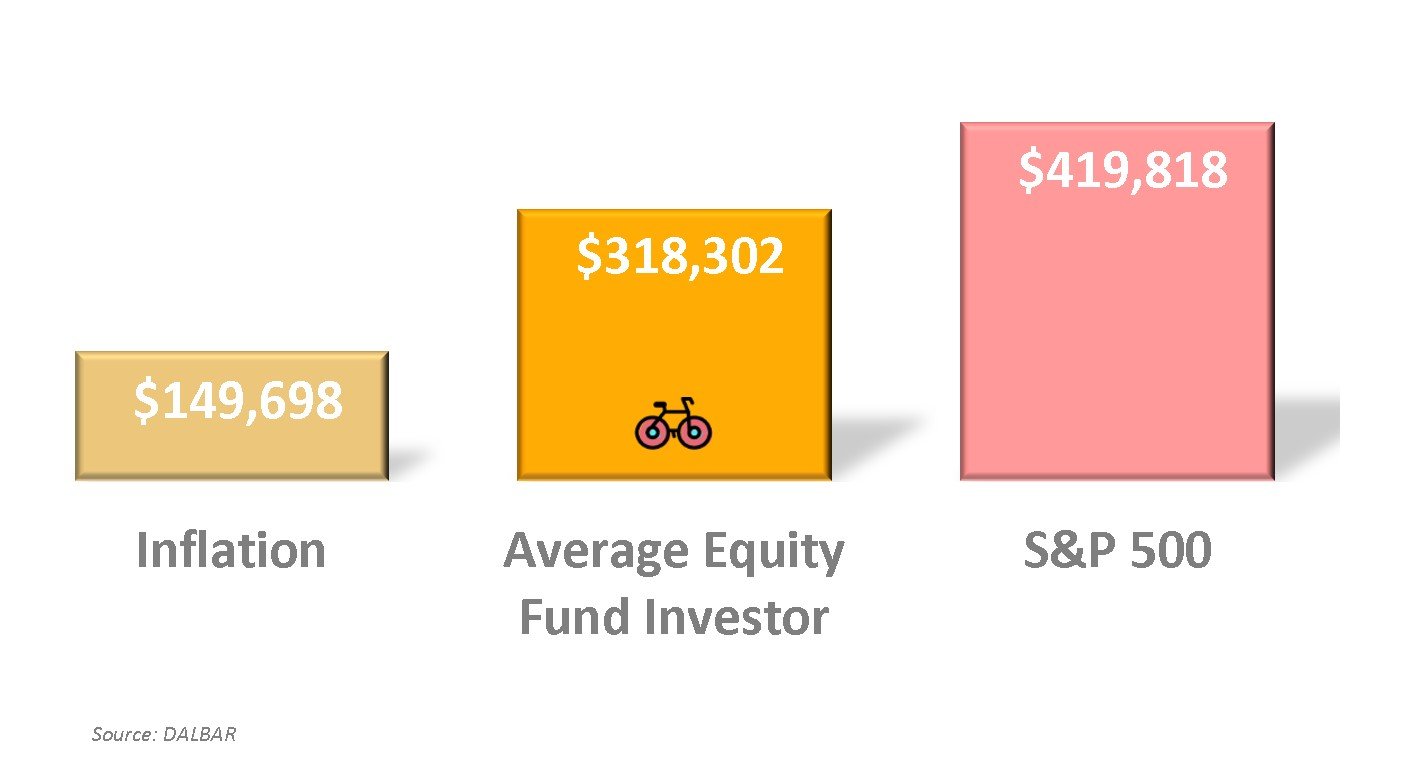
The good news is that following the recent COVID-19 crisis, investors are becoming more patient. Still, despite this improvement both the annual Dalbar study and Morningstar’s Mind the Gap Report monitoring investors in active funds show that poor behaviour costs a lot. A typical equity fund investor starting with $100,000 in 2001 wound up with $318,302 after 20 years. $100,000 less than if she invested in an S&P 500 tracker.
#7 Even the Smartest Will question their game plan
Expected Outperformance means additional risk
The risk of seeing your portfolio down for a decade.
Performance Ratio Of Growth And Value Stocks Vs S&P 500
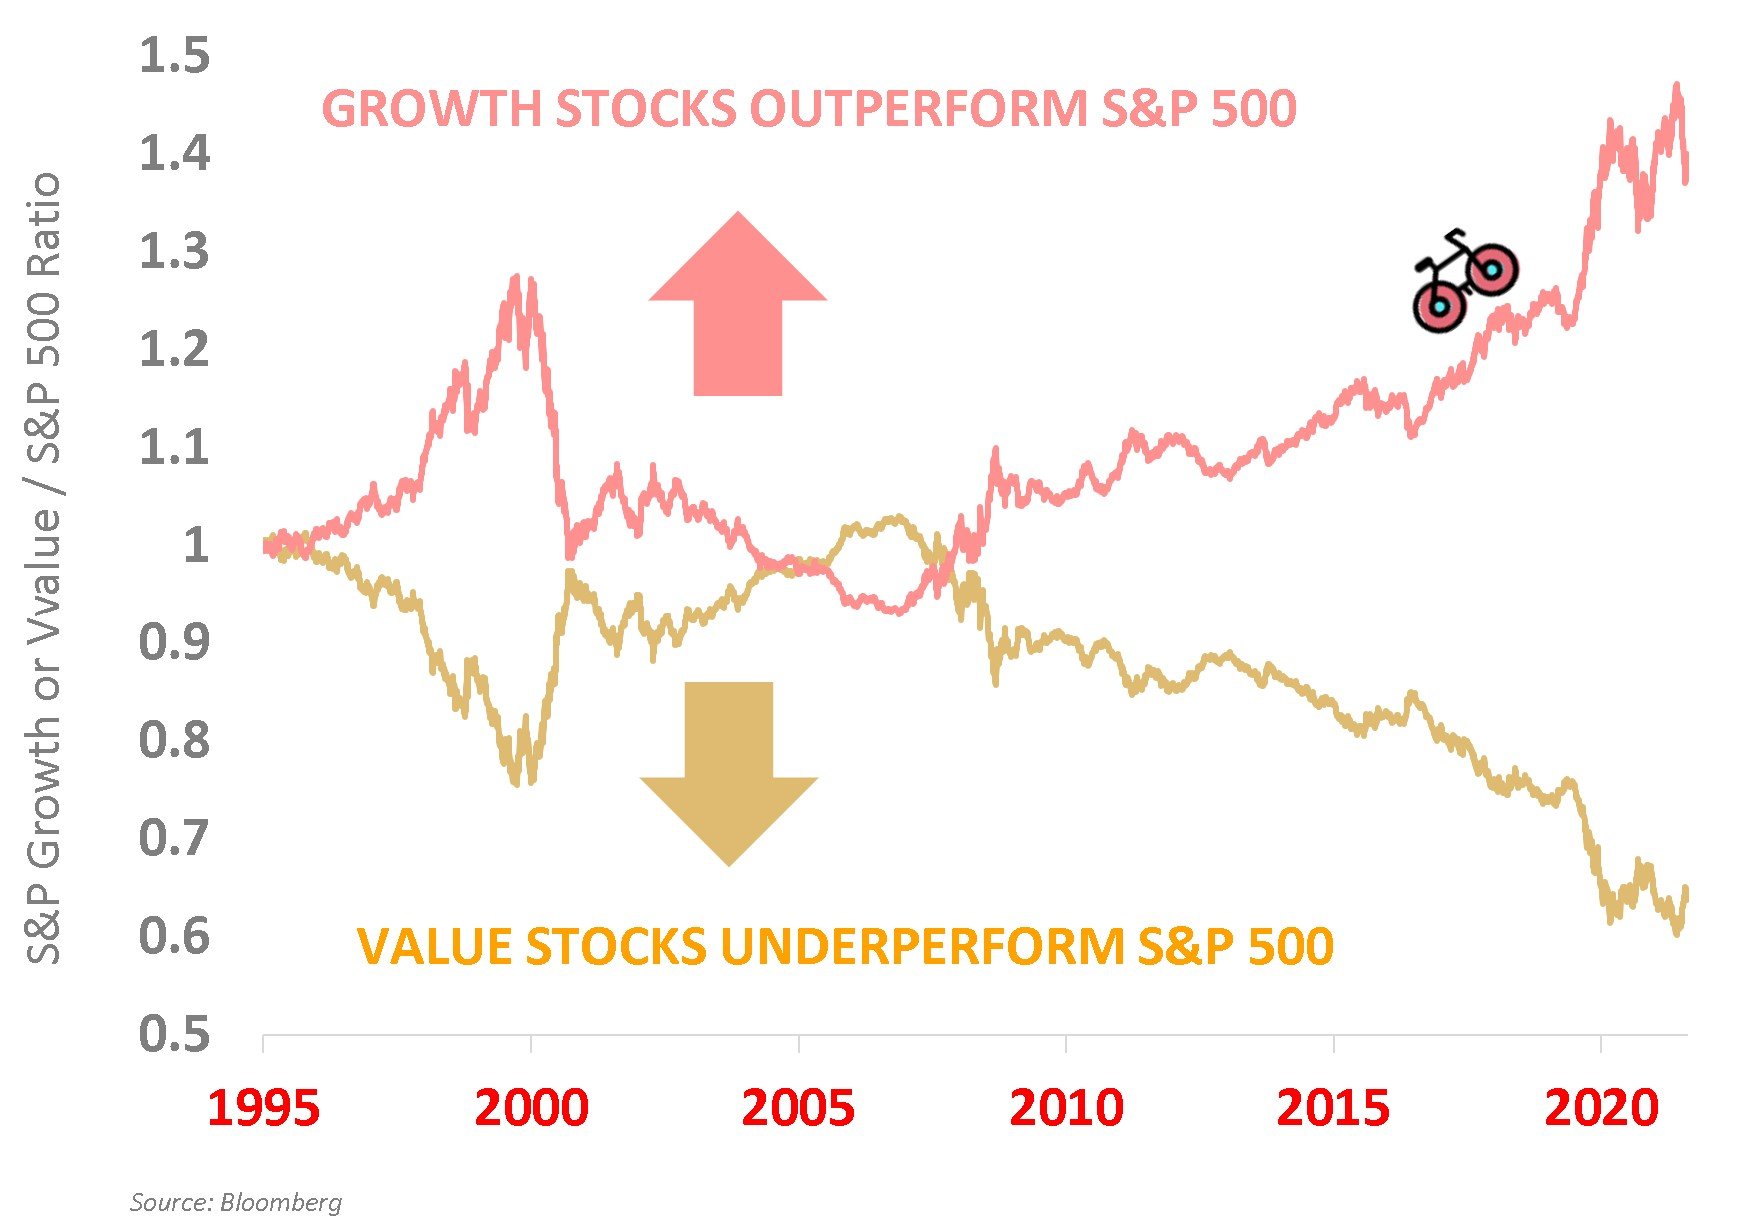
Perhaps you’re one of those investors not panicking during sell-offs. Well done. But as an evidence-based investor, you want to squeeze out all the juice. Factors such as small cap value could deliver in the long run. But in the medium term, it may not work in your favour.
Slow and consistent underperformance – also called tracking-error vs the S&P 500 – can make you doubt.
There could be new narratives suggesting why past factors may not persist. The world 30 years from now will look a lot different. “Value” and “Size” may not be what they were in the 20th century. The underperformance may last 20 years to see any benefit from a tilt. Value investors learned it the hard way.
If you abandon the strategy, then you permanently lock in the underperformance.
#8 MARKETS ARE INEFFICIENT. SO ARE YOU.
Taking a chance in THe least efficient markets?
That's where active investing underperforms the most.
The pattern of stock prices may look like that of a drunk man's walk
In the 1920s, the French mathematician Louis Bachelier first described the price behaviour of stocks in the paper Théorie de la spéculation as random.
Why? This makes sense, since currently available information is supposed to be already captured in the price. It also makes risk-adjusted outperformance unlikely.
Five decades later, Burton Malkiel popularised the concept of efficient markets hypothesis, in a book we reviewed a few months ago. Today, most investors, including Malkiel, agree that market prices are often wrong.
However, it doesn’t make investors any more likely to succeed. Because no one knows for sure if prices are too high or too low.
In fact, based on his 2011 paper, efficient markets are compatible with Market Bubbles or Behavioural factors including the Momentum risk premium.
In any case, inefficiencies won’t make you likely to be able to exploit them. On top of biases, taxes and fees are the second-biggest reason why active investors underperform. Due to the last couple, 95% of Emerging Market Portfolio Managers underperform their benchmarks. The highest for all geographies. Despite Emerging Markets arguably being the least efficient.
From Bankeronwheels.com
Get Wise The Most Relevant Independent Weekly Insights For Individual Investors In Europe & the UK
Liked the quality of our guides? There is more. Every week we release new guides, tools and compile the best insights from all corners of the web related to investing, early retirement & lifestyle along with exclusive articles, and way more. Probably the best newsletter for Individual Investors in Europe and the UK. Try it. Feel free to unsubscribe at any time.
🎁 In the first email, you can download a FREE comprehensive 2-page checklist to construct & monitor your portfolio and clean up your personal finances.
#9 Your Losses are LIKELY TO BE IRREVERSIBLE
The first rule of investing is don't lose money.
And the second rule of investing is don't forget the first rule
Required Return to Break Even
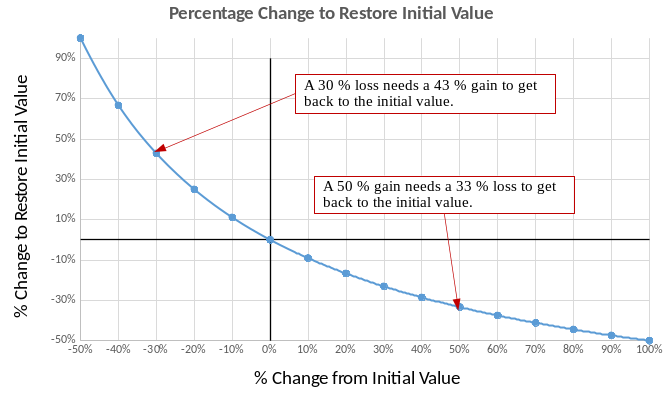
Warren Buffett often repeats: “The first rule of investing is don’t lose money. And the second rule of investing is don’t forget the first rule”. The math works against you. If you lose 30% you need 43% gain to make it back. If you lose 50% you need 100% gain to recoup the losses. And while the market always bounces back, individual stocks or even sectors may not. In summary, it would be wise to make a diversified ETF the core of your portfolio before your next bet!
Good Luck and Keep’em* Rolling!
(* Wheels & Dividends)


Weekend Reading – BlackRock Launches New iBonds, Truth About €1M Broker Insurance & BOW is 4 years old!


The Truth About €1 Million Broker Guarantees


4 Things I Learned In 4 Years Of Running A Finance Blog

Dodl By AJ Bell Review – AJ Bell’s Younger Brother


Vanguard LifeStrategy Review – A Retriever In A Babushka Doll


Why Do Portfolio Managers Care About Factors? It’s Not What You Think.
HELP US
🙋 Wondering why finding honest Investing Guidance is so difficult? That’s because running an independent website like ours is very hard work. If You Found Value In Our Content And Wish To Support Our Mission To Help Others, Consider:
- 📞 setting up a coaching session
- ☕ Treating us to a coffee
- 🐶 Purchasing Our Official Merchandise
- ❤️ Exploring Other ways to support our growth, both financially and non-financially.
DISCLAIMER
All information found here, including any ideas, opinions, views, predictions expressed or implied herein, are for informational, entertainment or educational purposes only and do not constitute financial advice. Consider the appropriateness of the information having regard to your objectives, financial situation and needs, and seek professional advice where appropriate. Read our full terms and conditions.


